Barbadian vs Immigrants from Pakistan Householder Income Over 65 years

COMPARE

Barbadian
Race
Ancestry
AfghanAfricanAlaska NativeAlaskan AthabascanAlbanianAleutAlsatianAmericanApacheArabArapahoArgentineanArmenianAssyrian/Chaldean/SyriacAustralianAustrianBahamianBangladeshiBarbadianBasqueBelgianBelizeanBermudanBhutaneseBlackfeetBolivianBrazilianBritishBritish West IndianBulgarianBurmeseCajunCambodianCanadianCape VerdeanCarpatho RusynCelticCentral AmericanCentral American IndianCherokeeCheyenneChickasawChileanChineseChippewaChoctawColombianColvilleComancheCosta RicanCreeCreekCroatianCrowCubanCypriotCzechCzechoslovakianDanishDelawareDominicanDutchDutch West IndianEastern EuropeanEcuadorianEgyptianEnglishEstonianEthiopianEuropeanFijianFilipinoFinnishFrenchFrench American IndianFrench CanadianGermanGerman RussianGhanaianGreekGuamanian/ChamorroGuatemalanGuyaneseHaitianHmongHonduranHopiHoumaHungarianIcelanderIndian (Asian)IndonesianInupiatIranianIraqiIrishIroquoisIsraeliItalianJamaicanJapaneseJordanianKenyanKiowaKoreanLaotianLatvianLebaneseLiberianLithuanianLumbeeLuxembourgerMacedonianMalaysianMalteseMarshalleseMenomineeMexicanMexican American IndianMongolianMoroccanNative HawaiianNavajoNepaleseNew ZealanderNicaraguanNigerianNorthern EuropeanNorwegianOkinawanOsageOttawaPaiutePakistaniPalestinianPanamanianParaguayanPennsylvania GermanPeruvianPimaPolishPortuguesePotawatomiPuebloPuerto RicanPuget Sound SalishRomanianRussianSalvadoranSamoanScandinavianScotch-IrishScottishSeminoleSenegaleseSerbianShoshoneSierra LeoneanSiouxSlavicSlovakSloveneSomaliSouth AfricanSouth AmericanSouth American IndianSoviet UnionSpaniardSpanishSpanish AmericanSpanish American IndianSri LankanSubsaharan AfricanSudaneseSwedishSwissSyrianTaiwaneseThaiTlingit-HaidaTohono O'OdhamTonganTrinidadian and TobagonianTsimshianTurkishU.S. Virgin IslanderUgandanUkrainianUruguayanUteVenezuelanVietnameseWelshWest IndianYakamaYaquiYugoslavianYumanYup'ikZimbabwean
Immigration
NonimmigrantsImmigrantsAfghanistanAfricaAlbaniaArgentinaArmeniaAsiaAustraliaAustriaBahamasBangladeshBarbadosBelarusBelgiumBelizeBoliviaBosnia and HerzegovinaBrazilBulgariaBurma/MyanmarCabo VerdeCambodiaCameroonCanadaCaribbeanCentral AmericaChileChinaColombiaCongoCosta RicaCroatiaCubaCzechoslovakiaDenmarkDominicaDominican RepublicEastern AfricaEastern AsiaEastern EuropeEcuadorEgyptEl SalvadorEnglandEritreaEthiopiaEuropeFijiFranceGermanyGhanaGreeceGrenadaGuatemalaGuyanaHaitiHondurasHong KongHungaryIndiaIndonesiaIranIraqIrelandIsraelItalyJamaicaJapanJordanKazakhstanKenyaKoreaKuwaitLaosLatin AmericaLatviaLebanonLiberiaLithuaniaMalaysiaMexicoMicronesiaMiddle AfricaMoldovaMoroccoNepalNetherlandsNicaraguaNigeriaNorth AmericaNorth MacedoniaNorthern AfricaNorthern EuropeNorwayOceaniaPanamaPeruPhilippinesPolandPortugalRomaniaRussiaSaudi ArabiaScotlandSenegalSerbiaSierra LeoneSingaporeSomaliaSouth AfricaSouth AmericaSouth Central AsiaSouth Eastern AsiaSouthern EuropeSpainSri LankaSt. Vincent and the GrenadinesSudanSwedenSwitzerlandSyriaTaiwanThailandTrinidad and TobagoTurkeyUgandaUkraineUruguayUzbekistanVenezuelaVietnamWest IndiesWestern AfricaWestern AsiaWestern EuropeYemenZaireZimbabweAzores
Immigrants from Pakistan
Race
Ancestry
AfghanAfricanAlaska NativeAlaskan AthabascanAlbanianAleutAlsatianAmericanApacheArabArapahoArgentineanArmenianAssyrian/Chaldean/SyriacAustralianAustrianBahamianBangladeshiBasqueBelgianBelizeanBermudanBhutaneseBlackfeetBolivianBrazilianBritishBritish West IndianBulgarianBurmeseCajunCambodianCanadianCape VerdeanCarpatho RusynCelticCentral AmericanCentral American IndianCherokeeCheyenneChickasawChileanChineseChippewaChoctawColombianColvilleComancheCosta RicanCreeCreekCroatianCrowCubanCypriotCzechCzechoslovakianDanishDelawareDominicanDutchDutch West IndianEastern EuropeanEcuadorianEgyptianEnglishEstonianEthiopianEuropeanFijianFilipinoFinnishFrenchFrench American IndianFrench CanadianGermanGerman RussianGhanaianGreekGuamanian/ChamorroGuatemalanGuyaneseHaitianHmongHonduranHopiHoumaHungarianIcelanderIndian (Asian)IndonesianInupiatIranianIraqiIrishIroquoisIsraeliItalianJamaicanJapaneseJordanianKenyanKiowaKoreanLaotianLatvianLebaneseLiberianLithuanianLumbeeLuxembourgerMacedonianMalaysianMalteseMarshalleseMenomineeMexicanMexican American IndianMongolianMoroccanNative HawaiianNavajoNepaleseNew ZealanderNicaraguanNigerianNorthern EuropeanNorwegianOkinawanOsageOttawaPaiutePakistaniPalestinianPanamanianParaguayanPennsylvania GermanPeruvianPimaPolishPortuguesePotawatomiPuebloPuerto RicanPuget Sound SalishRomanianRussianSalvadoranSamoanScandinavianScotch-IrishScottishSeminoleSenegaleseSerbianShoshoneSierra LeoneanSiouxSlavicSlovakSloveneSomaliSouth AfricanSouth AmericanSouth American IndianSoviet UnionSpaniardSpanishSpanish AmericanSpanish American IndianSri LankanSubsaharan AfricanSudaneseSwedishSwissSyrianTaiwaneseThaiTlingit-HaidaTohono O'OdhamTonganTrinidadian and TobagonianTsimshianTurkishU.S. Virgin IslanderUgandanUkrainianUruguayanUteVenezuelanVietnameseWelshWest IndianYakamaYaquiYugoslavianYumanYup'ikZimbabwean
Immigration
NonimmigrantsImmigrantsAfghanistanAfricaAlbaniaArgentinaArmeniaAsiaAustraliaAustriaBahamasBangladeshBarbadosBelarusBelgiumBelizeBoliviaBosnia and HerzegovinaBrazilBulgariaBurma/MyanmarCabo VerdeCambodiaCameroonCanadaCaribbeanCentral AmericaChileChinaColombiaCongoCosta RicaCroatiaCubaCzechoslovakiaDenmarkDominicaDominican RepublicEastern AfricaEastern AsiaEastern EuropeEcuadorEgyptEl SalvadorEnglandEritreaEthiopiaEuropeFijiFranceGermanyGhanaGreeceGrenadaGuatemalaGuyanaHaitiHondurasHong KongHungaryIndiaIndonesiaIranIraqIrelandIsraelItalyJamaicaJapanJordanKazakhstanKenyaKoreaKuwaitLaosLatin AmericaLatviaLebanonLiberiaLithuaniaMalaysiaMexicoMicronesiaMiddle AfricaMoldovaMoroccoNepalNetherlandsNicaraguaNigeriaNorth AmericaNorth MacedoniaNorthern AfricaNorthern EuropeNorwayOceaniaPakistanPanamaPeruPhilippinesPolandPortugalRomaniaRussiaSaudi ArabiaScotlandSenegalSerbiaSierra LeoneSingaporeSomaliaSouth AfricaSouth AmericaSouth Central AsiaSouth Eastern AsiaSouthern EuropeSpainSri LankaSt. Vincent and the GrenadinesSudanSwedenSwitzerlandSyriaTaiwanThailandTrinidad and TobagoTurkeyUgandaUkraineUruguayUzbekistanVenezuelaVietnamWest IndiesWestern AfricaWestern AsiaWestern EuropeYemenZaireZimbabweAzores
Householder Income Over 65 years
Income
Poverty
Unemployment
Labor Participation
Family Structure
Vehicle Availability
Education Level
Disability

Householder Income Over 65 years Comparison

Barbadians

Immigrants from Pakistan

Tragic
Exceptional
$54,163
HOUSEHOLDER INCOME OVER 65 YEARS
0.1/ 100
METRIC RATING
274th/ 347
METRIC RANK
$66,617
HOUSEHOLDER INCOME OVER 65 YEARS
99.7/ 100
METRIC RATING
53rd/ 347
METRIC RANK

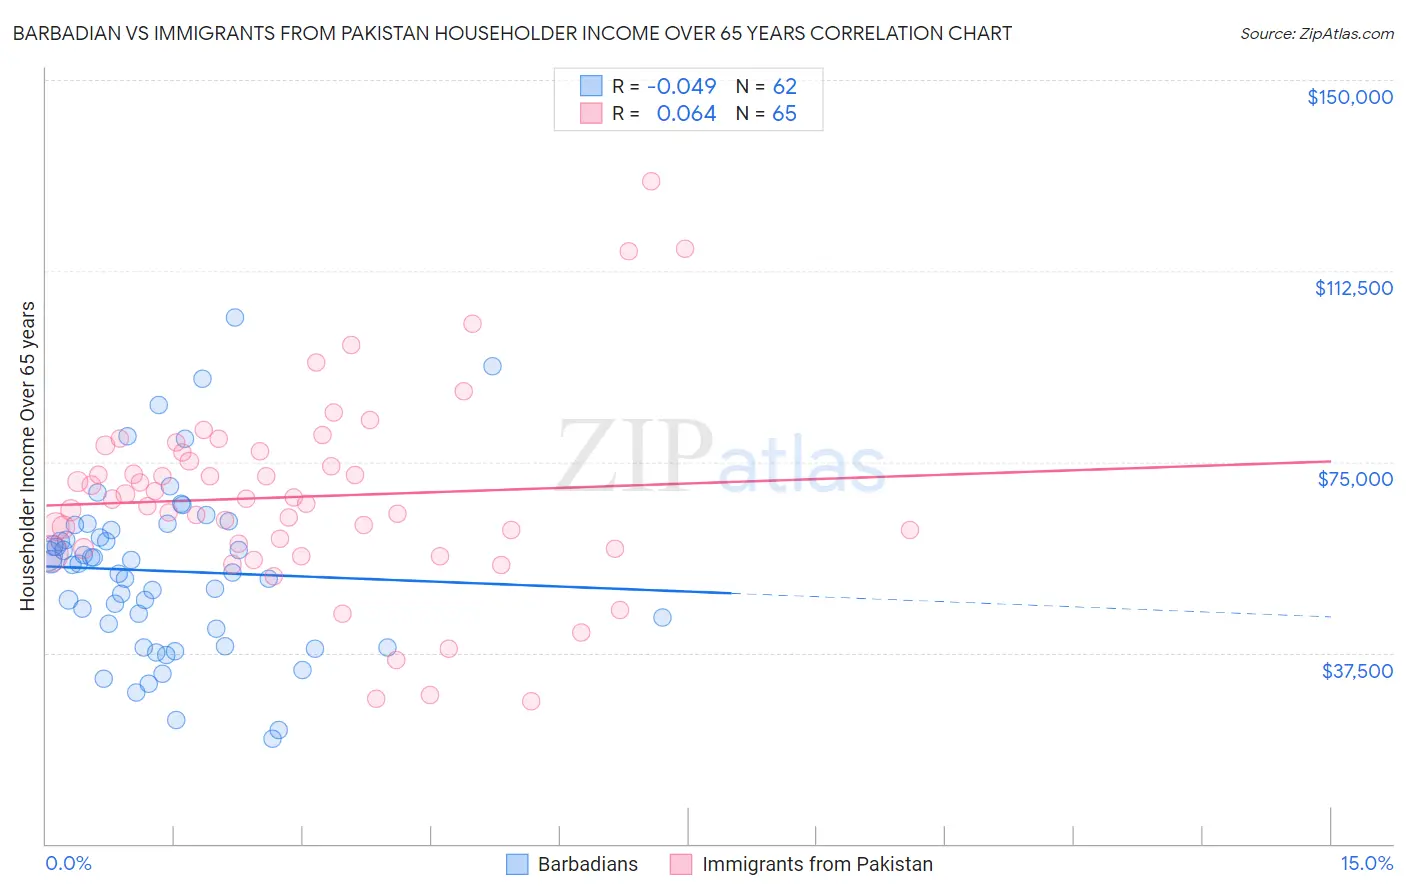
Barbadian vs Immigrants from Pakistan Householder Income Over 65 years Correlation Chart

The statistical analysis conducted on geographies consisting of 141,115,722 people shows no correlation between the proportion of Barbadians and household income with householder over the age of 65 in the United States with a correlation coefficient (R) of -0.049 and weighted average of $54,163. Similarly, the statistical analysis conducted on geographies consisting of 283,337,476 people shows a slight positive correlation between the proportion of Immigrants from Pakistan and household income with householder over the age of 65 in the United States with a correlation coefficient (R) of 0.064 and weighted average of $66,617, a difference of 23.0%.
Barbadian vs Immigrants from Pakistan Householder Income Over 65 years

Householder Income Over 65 years Correlation Summary

MeasurementBarbadianImmigrants from Pakistan
Minimum$20,697$28,023
Maximum$103,317$130,000
Range$82,620$101,977
Mean$53,555$68,143
Median$54,900$67,687
Interquartile 25% (IQ1)$42,188$57,969
Interquartile 75% (IQ3)$61,698$76,959
Interquartile Range (IQR)$19,510$18,990
Standard Deviation (Sample)$16,744$19,154
Standard Deviation (Population)$16,609$19,006

Similar Demographics by Householder Income Over 65 years

Demographics Similar to Barbadians by Householder Income Over 65 years

In terms of householder income over 65 years, the demographic groups most similar to Barbadians are Indonesian ($54,176, a difference of 0.020%), Cherokee ($54,133, a difference of 0.060%), Cree ($54,129, a difference of 0.060%), Potawatomi ($54,212, a difference of 0.090%), and Cheyenne ($54,096, a difference of 0.12%).
DemographicsRating | RankHouseholder Income Over 65 years
Guatemalans
0.1
/100
|
#267
Tragic
$54,526
Immigrants | Zaire
0.1
/100
|
#268
Tragic
$54,512
Nicaraguans
0.1
/100
|
#269
Tragic
$54,474
Immigrants | Senegal
0.1
/100
|
#270
Tragic
$54,447
Liberians
0.1
/100
|
#271
Tragic
$54,356
Potawatomi
0.1
/100
|
#272
Tragic
$54,212
Indonesians
0.1
/100
|
#273
Tragic
$54,176
Barbadians
0.1
/100
|
#274
Tragic
$54,163
Cherokee
0.1
/100
|
#275
Tragic
$54,133
Cree
0.1
/100
|
#276
Tragic
$54,129
Cheyenne
0.1
/100
|
#277
Tragic
$54,096
Immigrants | Ecuador
0.1
/100
|
#278
Tragic
$54,030
Blackfeet
0.1
/100
|
#279
Tragic
$54,029
Immigrants | Jamaica
0.1
/100
|
#280
Tragic
$54,027
Somalis
0.1
/100
|
#281
Tragic
$54,004

Demographics Similar to Immigrants from Pakistan by Householder Income Over 65 years

In terms of householder income over 65 years, the demographic groups most similar to Immigrants from Pakistan are Immigrants from Scotland ($66,620, a difference of 0.0%), Israeli ($66,636, a difference of 0.030%), Immigrants from Turkey ($66,672, a difference of 0.080%), Immigrants from Indonesia ($66,694, a difference of 0.12%), and Immigrants from Netherlands ($66,463, a difference of 0.23%).
DemographicsRating | RankHouseholder Income Over 65 years
Cambodians
99.8
/100
|
#46
Exceptional
$66,892
Australians
99.8
/100
|
#47
Exceptional
$66,891
Immigrants | France
99.8
/100
|
#48
Exceptional
$66,826
Immigrants | Indonesia
99.8
/100
|
#49
Exceptional
$66,694
Immigrants | Turkey
99.7
/100
|
#50
Exceptional
$66,672
Israelis
99.7
/100
|
#51
Exceptional
$66,636
Immigrants | Scotland
99.7
/100
|
#52
Exceptional
$66,620
Immigrants | Pakistan
99.7
/100
|
#53
Exceptional
$66,617
Immigrants | Netherlands
99.7
/100
|
#54
Exceptional
$66,463
Immigrants | Czechoslovakia
99.7
/100
|
#55
Exceptional
$66,376
Laotians
99.6
/100
|
#56
Exceptional
$66,306
Bulgarians
99.6
/100
|
#57
Exceptional
$66,236
Immigrants | Philippines
99.6
/100
|
#58
Exceptional
$66,161
Immigrants | Norway
99.5
/100
|
#59
Exceptional
$66,118
Immigrants | Lithuania
99.5
/100
|
#60
Exceptional
$66,087