Bangladeshi vs Potawatomi Householder Income Under 25 years
COMPARE
Bangladeshi
Potawatomi
Householder Income Under 25 years
Householder Income Under 25 years Comparison
Bangladeshis
Potawatomi
$47,589
HOUSEHOLDER INCOME UNDER 25 YEARS
0.0/ 100
METRIC RATING
307th/ 347
METRIC RANK
$46,462
HOUSEHOLDER INCOME UNDER 25 YEARS
0.0/ 100
METRIC RATING
321st/ 347
METRIC RANK
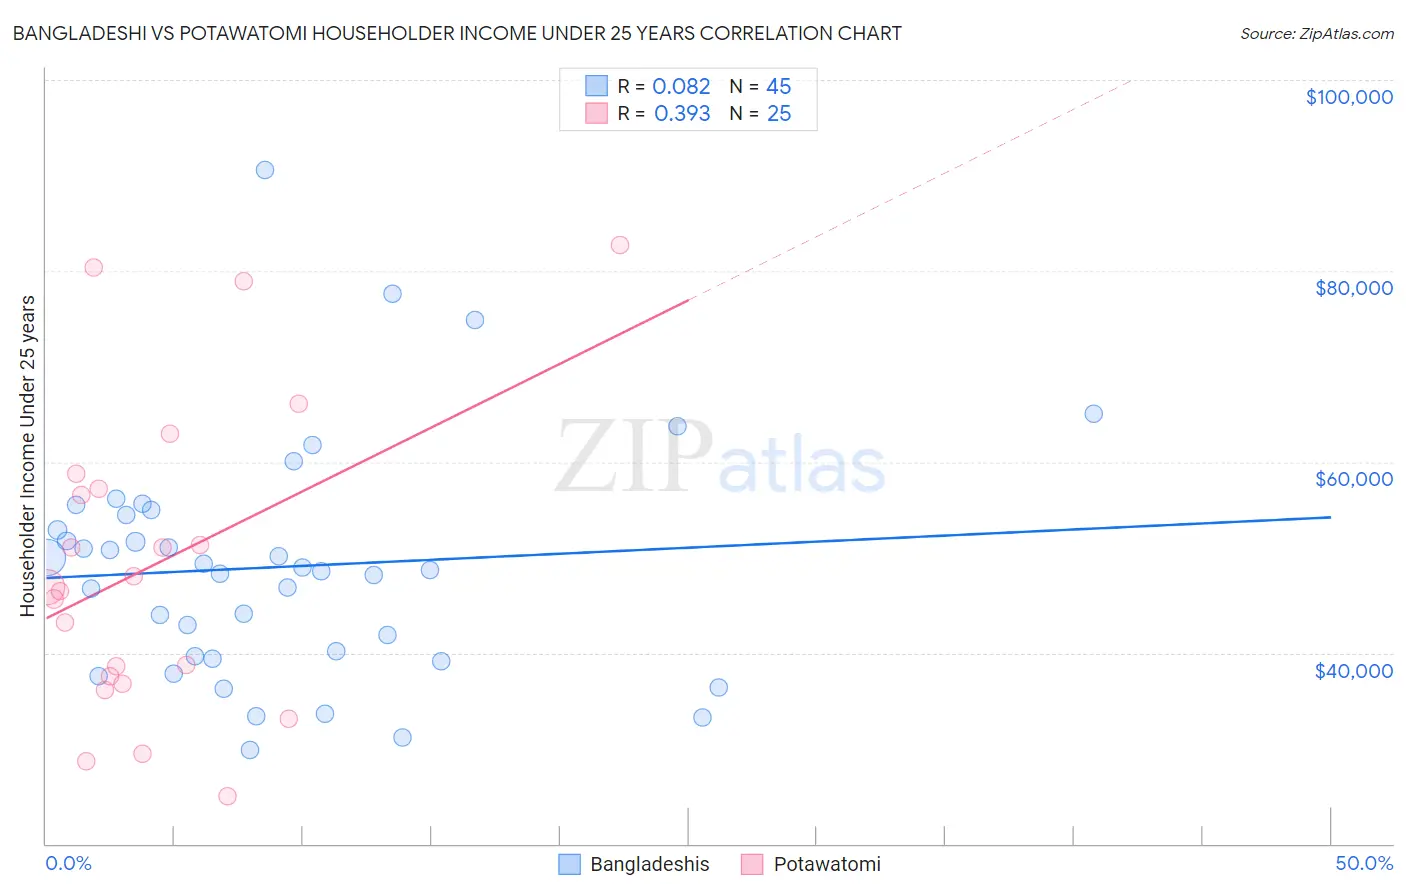
Bangladeshi vs Potawatomi Householder Income Under 25 years Correlation Chart
The statistical analysis conducted on geographies consisting of 131,389,647 people shows a slight positive correlation between the proportion of Bangladeshis and household income with householder under the age of 25 in the United States with a correlation coefficient (R) of 0.082 and weighted average of $47,589. Similarly, the statistical analysis conducted on geographies consisting of 111,079,287 people shows a mild positive correlation between the proportion of Potawatomi and household income with householder under the age of 25 in the United States with a correlation coefficient (R) of 0.393 and weighted average of $46,462, a difference of 2.4%.
Householder Income Under 25 years Correlation Summary
| Measurement | Bangladeshi | Potawatomi |
| Minimum | $29,883 | $25,000 |
| Maximum | $90,583 | $82,708 |
| Range | $60,700 | $57,708 |
| Mean | $49,001 | $49,228 |
| Median | $48,654 | $46,870 |
| Interquartile 25% (IQ1) | $39,531 | $37,131 |
| Interquartile 75% (IQ3) | $54,671 | $57,967 |
| Interquartile Range (IQR) | $15,140 | $20,836 |
| Standard Deviation (Sample) | $12,360 | $15,912 |
| Standard Deviation (Population) | $12,222 | $15,591 |
Demographics Similar to Bangladeshis and Potawatomi by Householder Income Under 25 years
In terms of householder income under 25 years, the demographic groups most similar to Bangladeshis are Comanche ($47,518, a difference of 0.15%), Native/Alaskan ($47,704, a difference of 0.24%), U.S. Virgin Islander ($47,448, a difference of 0.30%), Iroquois ($47,380, a difference of 0.44%), and Ottawa ($47,366, a difference of 0.47%). Similarly, the demographic groups most similar to Potawatomi are Sioux ($46,417, a difference of 0.10%), Immigrants from Saudi Arabia ($46,187, a difference of 0.60%), Immigrants from Sudan ($46,791, a difference of 0.71%), African ($46,838, a difference of 0.81%), and Spanish American ($46,913, a difference of 0.97%).
| Demographics | Rating | Rank | Householder Income Under 25 years |
| Menominee | 0.0 /100 | #304 | Tragic $47,907 |
| Cherokee | 0.0 /100 | #305 | Tragic $47,848 |
| Natives/Alaskans | 0.0 /100 | #306 | Tragic $47,704 |
| Bangladeshis | 0.0 /100 | #307 | Tragic $47,589 |
| Comanche | 0.0 /100 | #308 | Tragic $47,518 |
| U.S. Virgin Islanders | 0.0 /100 | #309 | Tragic $47,448 |
| Iroquois | 0.0 /100 | #310 | Tragic $47,380 |
| Ottawa | 0.0 /100 | #311 | Tragic $47,366 |
| Bermudans | 0.0 /100 | #312 | Tragic $47,359 |
| Delaware | 0.0 /100 | #313 | Tragic $47,159 |
| Chippewa | 0.0 /100 | #314 | Tragic $47,015 |
| Crow | 0.0 /100 | #315 | Tragic $47,012 |
| Sudanese | 0.0 /100 | #316 | Tragic $46,982 |
| Hopi | 0.0 /100 | #317 | Tragic $46,978 |
| Spanish Americans | 0.0 /100 | #318 | Tragic $46,913 |
| Africans | 0.0 /100 | #319 | Tragic $46,838 |
| Immigrants | Sudan | 0.0 /100 | #320 | Tragic $46,791 |
| Potawatomi | 0.0 /100 | #321 | Tragic $46,462 |
| Sioux | 0.0 /100 | #322 | Tragic $46,417 |
| Immigrants | Saudi Arabia | 0.0 /100 | #323 | Tragic $46,187 |
| Dutch West Indians | 0.0 /100 | #324 | Tragic $45,816 |