Australian vs Latvian Householder Income Over 65 years
COMPARE
Australian
Latvian
Householder Income Over 65 years
Householder Income Over 65 years Comparison
Australians
Latvians
$66,891
HOUSEHOLDER INCOME OVER 65 YEARS
99.8/ 100
METRIC RATING
47th/ 347
METRIC RANK
$67,326
HOUSEHOLDER INCOME OVER 65 YEARS
99.9/ 100
METRIC RATING
43rd/ 347
METRIC RANK
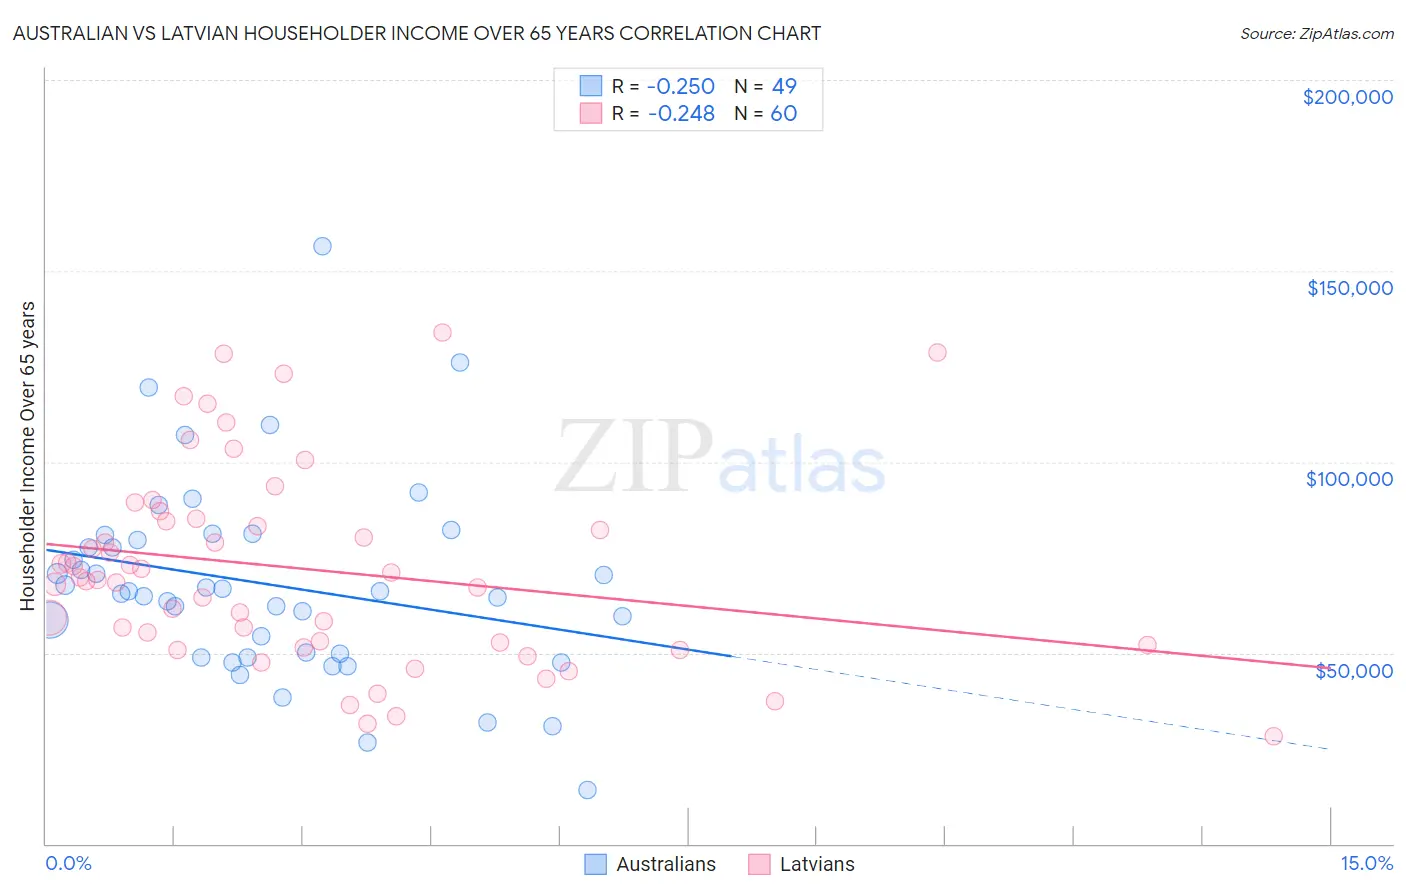
Australian vs Latvian Householder Income Over 65 years Correlation Chart
The statistical analysis conducted on geographies consisting of 223,634,987 people shows a weak negative correlation between the proportion of Australians and household income with householder over the age of 65 in the United States with a correlation coefficient (R) of -0.250 and weighted average of $66,891. Similarly, the statistical analysis conducted on geographies consisting of 220,279,935 people shows a weak negative correlation between the proportion of Latvians and household income with householder over the age of 65 in the United States with a correlation coefficient (R) of -0.248 and weighted average of $67,326, a difference of 0.65%.
Householder Income Over 65 years Correlation Summary
| Measurement | Australian | Latvian |
| Minimum | $13,929 | $28,148 |
| Maximum | $156,341 | $133,874 |
| Range | $142,412 | $105,726 |
| Mean | $67,933 | $71,961 |
| Median | $66,111 | $69,364 |
| Interquartile 25% (IQ1) | $49,254 | $52,318 |
| Interquartile 75% (IQ3) | $80,198 | $84,761 |
| Interquartile Range (IQR) | $30,944 | $32,443 |
| Standard Deviation (Sample) | $25,877 | $25,745 |
| Standard Deviation (Population) | $25,612 | $25,529 |
Demographics Similar to Australians and Latvians by Householder Income Over 65 years
In terms of householder income over 65 years, the demographic groups most similar to Australians are Cambodian ($66,892, a difference of 0.0%), Immigrants from France ($66,826, a difference of 0.10%), Immigrants from Afghanistan ($67,007, a difference of 0.17%), Immigrants from Indonesia ($66,694, a difference of 0.29%), and Immigrants from Turkey ($66,672, a difference of 0.33%). Similarly, the demographic groups most similar to Latvians are New Zealander ($67,333, a difference of 0.010%), Immigrants from South Africa ($67,234, a difference of 0.14%), Korean ($67,472, a difference of 0.22%), Immigrants from Asia ($67,594, a difference of 0.40%), and Russian ($67,626, a difference of 0.45%).
| Demographics | Rating | Rank | Householder Income Over 65 years |
| Tongans | 100.0 /100 | #35 | Exceptional $68,235 |
| Immigrants | Austria | 99.9 /100 | #36 | Exceptional $68,208 |
| Turks | 99.9 /100 | #37 | Exceptional $68,037 |
| Estonians | 99.9 /100 | #38 | Exceptional $67,926 |
| Russians | 99.9 /100 | #39 | Exceptional $67,626 |
| Immigrants | Asia | 99.9 /100 | #40 | Exceptional $67,594 |
| Koreans | 99.9 /100 | #41 | Exceptional $67,472 |
| New Zealanders | 99.9 /100 | #42 | Exceptional $67,333 |
| Latvians | 99.9 /100 | #43 | Exceptional $67,326 |
| Immigrants | South Africa | 99.9 /100 | #44 | Exceptional $67,234 |
| Immigrants | Afghanistan | 99.8 /100 | #45 | Exceptional $67,007 |
| Cambodians | 99.8 /100 | #46 | Exceptional $66,892 |
| Australians | 99.8 /100 | #47 | Exceptional $66,891 |
| Immigrants | France | 99.8 /100 | #48 | Exceptional $66,826 |
| Immigrants | Indonesia | 99.8 /100 | #49 | Exceptional $66,694 |
| Immigrants | Turkey | 99.7 /100 | #50 | Exceptional $66,672 |
| Israelis | 99.7 /100 | #51 | Exceptional $66,636 |
| Immigrants | Scotland | 99.7 /100 | #52 | Exceptional $66,620 |
| Immigrants | Pakistan | 99.7 /100 | #53 | Exceptional $66,617 |
| Immigrants | Netherlands | 99.7 /100 | #54 | Exceptional $66,463 |
| Immigrants | Czechoslovakia | 99.7 /100 | #55 | Exceptional $66,376 |