Immigrants from Belarus vs Latvian Householder Income Over 65 years
COMPARE
Immigrants from Belarus
Latvian
Householder Income Over 65 years
Householder Income Over 65 years Comparison
Immigrants from Belarus
Latvians
$62,162
HOUSEHOLDER INCOME OVER 65 YEARS
77.8/ 100
METRIC RATING
143rd/ 347
METRIC RANK
$67,326
HOUSEHOLDER INCOME OVER 65 YEARS
99.9/ 100
METRIC RATING
43rd/ 347
METRIC RANK
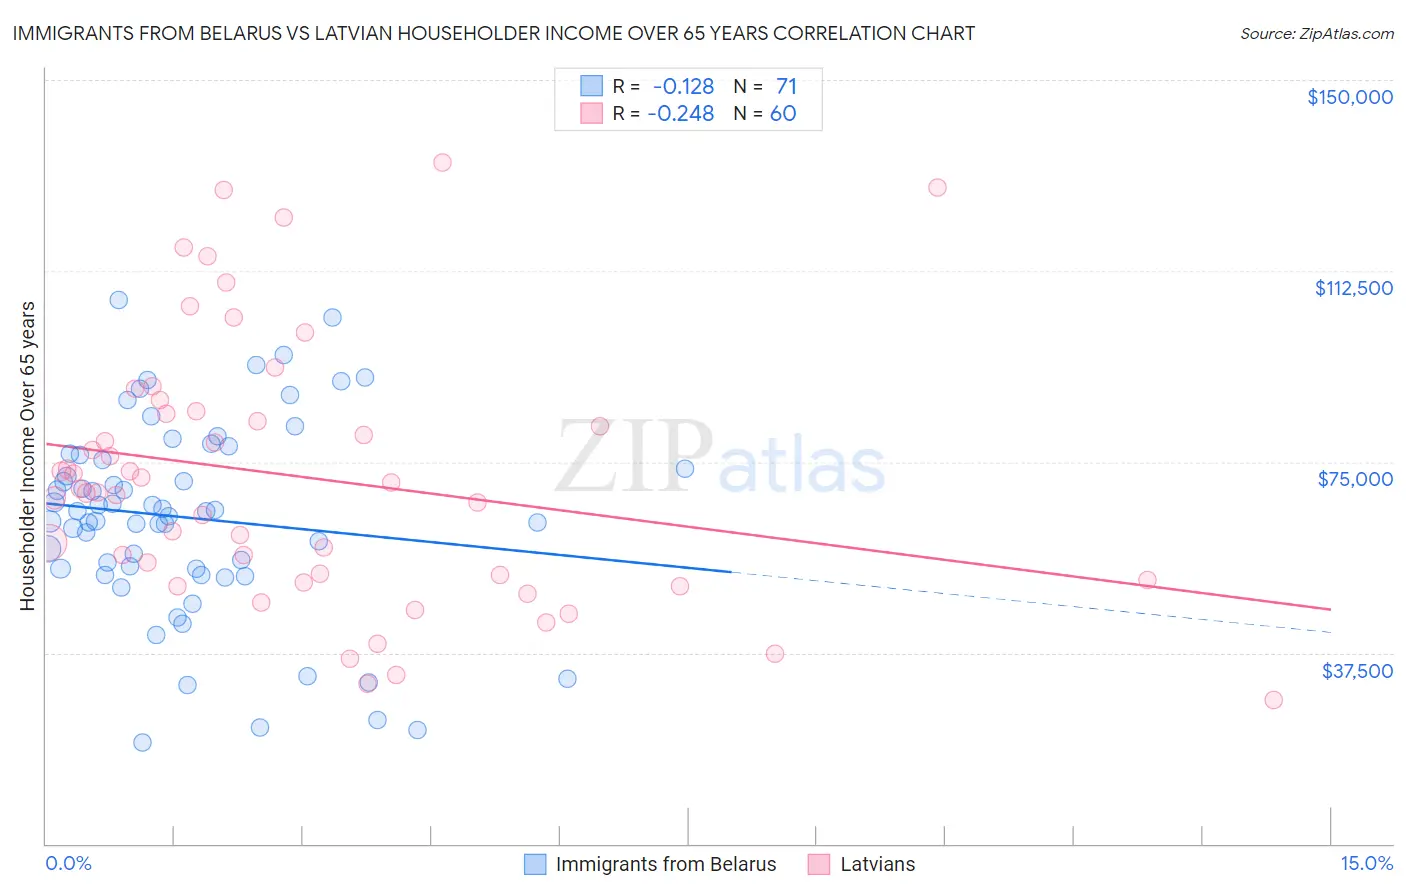
Immigrants from Belarus vs Latvian Householder Income Over 65 years Correlation Chart
The statistical analysis conducted on geographies consisting of 150,124,953 people shows a poor negative correlation between the proportion of Immigrants from Belarus and household income with householder over the age of 65 in the United States with a correlation coefficient (R) of -0.128 and weighted average of $62,162. Similarly, the statistical analysis conducted on geographies consisting of 220,279,935 people shows a weak negative correlation between the proportion of Latvians and household income with householder over the age of 65 in the United States with a correlation coefficient (R) of -0.248 and weighted average of $67,326, a difference of 8.3%.
Householder Income Over 65 years Correlation Summary
| Measurement | Immigrants from Belarus | Latvian |
| Minimum | $19,854 | $28,148 |
| Maximum | $106,741 | $133,874 |
| Range | $86,887 | $105,726 |
| Mean | $64,012 | $71,961 |
| Median | $65,250 | $69,364 |
| Interquartile 25% (IQ1) | $53,983 | $52,318 |
| Interquartile 75% (IQ3) | $76,256 | $84,761 |
| Interquartile Range (IQR) | $22,273 | $32,443 |
| Standard Deviation (Sample) | $19,180 | $25,745 |
| Standard Deviation (Population) | $19,044 | $25,529 |
Similar Demographics by Householder Income Over 65 years
Demographics Similar to Immigrants from Belarus by Householder Income Over 65 years
In terms of householder income over 65 years, the demographic groups most similar to Immigrants from Belarus are South American Indian ($62,215, a difference of 0.090%), Canadian ($62,230, a difference of 0.11%), Arab ($62,266, a difference of 0.17%), Lebanese ($62,287, a difference of 0.20%), and Immigrants from Kazakhstan ($62,292, a difference of 0.21%).
| Demographics | Rating | Rank | Householder Income Over 65 years |
| Alaskan Athabascans | 80.6 /100 | #136 | Excellent $62,330 |
| Immigrants | Syria | 80.2 /100 | #137 | Excellent $62,303 |
| Immigrants | Kazakhstan | 80.0 /100 | #138 | Excellent $62,292 |
| Lebanese | 79.9 /100 | #139 | Good $62,287 |
| Arabs | 79.6 /100 | #140 | Good $62,266 |
| Canadians | 79.0 /100 | #141 | Good $62,230 |
| South American Indians | 78.7 /100 | #142 | Good $62,215 |
| Immigrants | Belarus | 77.8 /100 | #143 | Good $62,162 |
| Immigrants | Peru | 74.4 /100 | #144 | Good $61,988 |
| Immigrants | Uganda | 74.2 /100 | #145 | Good $61,976 |
| Immigrants | Southern Europe | 72.7 /100 | #146 | Good $61,902 |
| Immigrants | Nepal | 71.4 /100 | #147 | Good $61,843 |
| Alsatians | 70.5 /100 | #148 | Good $61,797 |
| Scottish | 69.1 /100 | #149 | Good $61,735 |
| Slavs | 68.5 /100 | #150 | Good $61,709 |
Demographics Similar to Latvians by Householder Income Over 65 years
In terms of householder income over 65 years, the demographic groups most similar to Latvians are New Zealander ($67,333, a difference of 0.010%), Immigrants from South Africa ($67,234, a difference of 0.14%), Korean ($67,472, a difference of 0.22%), Immigrants from Asia ($67,594, a difference of 0.40%), and Russian ($67,626, a difference of 0.45%).
| Demographics | Rating | Rank | Householder Income Over 65 years |
| Immigrants | Austria | 99.9 /100 | #36 | Exceptional $68,208 |
| Turks | 99.9 /100 | #37 | Exceptional $68,037 |
| Estonians | 99.9 /100 | #38 | Exceptional $67,926 |
| Russians | 99.9 /100 | #39 | Exceptional $67,626 |
| Immigrants | Asia | 99.9 /100 | #40 | Exceptional $67,594 |
| Koreans | 99.9 /100 | #41 | Exceptional $67,472 |
| New Zealanders | 99.9 /100 | #42 | Exceptional $67,333 |
| Latvians | 99.9 /100 | #43 | Exceptional $67,326 |
| Immigrants | South Africa | 99.9 /100 | #44 | Exceptional $67,234 |
| Immigrants | Afghanistan | 99.8 /100 | #45 | Exceptional $67,007 |
| Cambodians | 99.8 /100 | #46 | Exceptional $66,892 |
| Australians | 99.8 /100 | #47 | Exceptional $66,891 |
| Immigrants | France | 99.8 /100 | #48 | Exceptional $66,826 |
| Immigrants | Indonesia | 99.8 /100 | #49 | Exceptional $66,694 |
| Immigrants | Turkey | 99.7 /100 | #50 | Exceptional $66,672 |