Cajun vs South African Householder Income Ages 25 - 44 years
COMPARE
Cajun
South African
Householder Income Ages 25 - 44 years
Householder Income Ages 25 - 44 years Comparison
Cajuns
South Africans
$82,393
HOUSEHOLDER INCOME AGES 25 - 44 YEARS
0.1/ 100
METRIC RATING
281st/ 347
METRIC RANK
$103,160
HOUSEHOLDER INCOME AGES 25 - 44 YEARS
99.2/ 100
METRIC RATING
81st/ 347
METRIC RANK
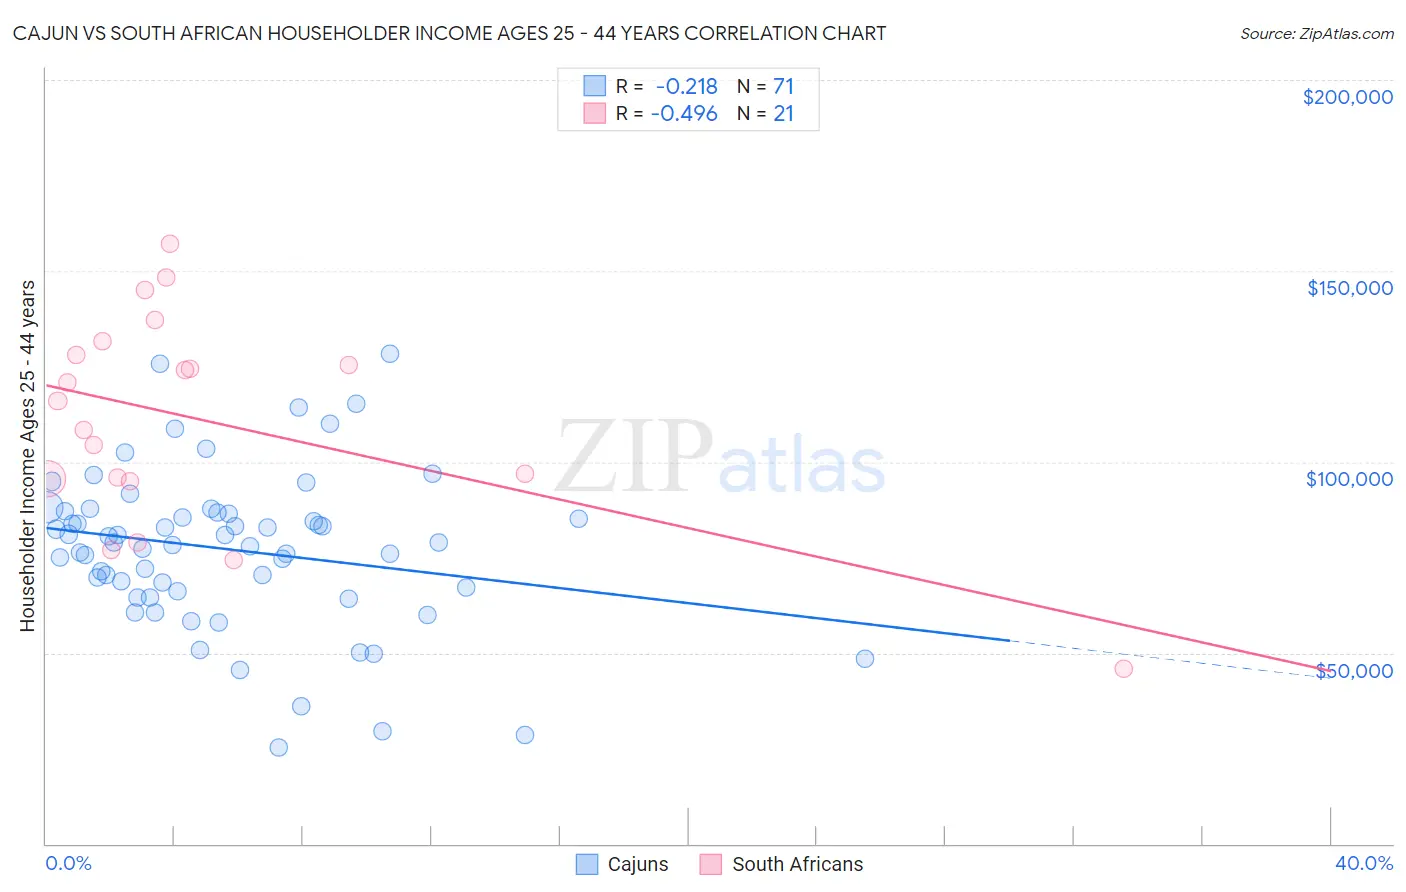
Cajun vs South African Householder Income Ages 25 - 44 years Correlation Chart
The statistical analysis conducted on geographies consisting of 149,428,991 people shows a weak negative correlation between the proportion of Cajuns and household income with householder between the ages 25 and 44 in the United States with a correlation coefficient (R) of -0.218 and weighted average of $82,393. Similarly, the statistical analysis conducted on geographies consisting of 182,377,934 people shows a moderate negative correlation between the proportion of South Africans and household income with householder between the ages 25 and 44 in the United States with a correlation coefficient (R) of -0.496 and weighted average of $103,160, a difference of 25.2%.
Householder Income Ages 25 - 44 years Correlation Summary
| Measurement | Cajun | South African |
| Minimum | $25,321 | $45,714 |
| Maximum | $128,296 | $156,974 |
| Range | $102,975 | $111,260 |
| Mean | $77,078 | $110,921 |
| Median | $78,831 | $115,903 |
| Interquartile 25% (IQ1) | $66,250 | $95,265 |
| Interquartile 75% (IQ3) | $86,857 | $129,677 |
| Interquartile Range (IQR) | $20,607 | $34,411 |
| Standard Deviation (Sample) | $20,566 | $27,826 |
| Standard Deviation (Population) | $20,421 | $27,156 |
Similar Demographics by Householder Income Ages 25 - 44 years
Demographics Similar to Cajuns by Householder Income Ages 25 - 44 years
In terms of householder income ages 25 - 44 years, the demographic groups most similar to Cajuns are Central American Indian ($82,355, a difference of 0.050%), Guatemalan ($82,331, a difference of 0.070%), Immigrants from Middle Africa ($82,254, a difference of 0.17%), Immigrants from Somalia ($82,188, a difference of 0.25%), and Colville ($82,604, a difference of 0.26%).
| Demographics | Rating | Rank | Householder Income Ages 25 - 44 years |
| Marshallese | 0.2 /100 | #274 | Tragic $83,575 |
| Immigrants | Jamaica | 0.2 /100 | #275 | Tragic $83,298 |
| Immigrants | Belize | 0.2 /100 | #276 | Tragic $83,141 |
| Paiute | 0.2 /100 | #277 | Tragic $82,984 |
| Senegalese | 0.2 /100 | #278 | Tragic $82,852 |
| Pima | 0.1 /100 | #279 | Tragic $82,821 |
| Colville | 0.1 /100 | #280 | Tragic $82,604 |
| Cajuns | 0.1 /100 | #281 | Tragic $82,393 |
| Central American Indians | 0.1 /100 | #282 | Tragic $82,355 |
| Guatemalans | 0.1 /100 | #283 | Tragic $82,331 |
| Immigrants | Middle Africa | 0.1 /100 | #284 | Tragic $82,254 |
| Immigrants | Somalia | 0.1 /100 | #285 | Tragic $82,188 |
| Ute | 0.1 /100 | #286 | Tragic $82,166 |
| Immigrants | Latin America | 0.1 /100 | #287 | Tragic $82,166 |
| Comanche | 0.1 /100 | #288 | Tragic $82,152 |
Demographics Similar to South Africans by Householder Income Ages 25 - 44 years
In terms of householder income ages 25 - 44 years, the demographic groups most similar to South Africans are Immigrants from Serbia ($103,155, a difference of 0.010%), Immigrants from Egypt ($103,192, a difference of 0.030%), Argentinean ($103,111, a difference of 0.050%), Armenian ($103,248, a difference of 0.080%), and Immigrants from Philippines ($102,910, a difference of 0.24%).
| Demographics | Rating | Rank | Householder Income Ages 25 - 44 years |
| Immigrants | Fiji | 99.5 /100 | #74 | Exceptional $103,954 |
| Koreans | 99.4 /100 | #75 | Exceptional $103,824 |
| Immigrants | Spain | 99.4 /100 | #76 | Exceptional $103,752 |
| Immigrants | Southern Europe | 99.3 /100 | #77 | Exceptional $103,486 |
| Immigrants | Bulgaria | 99.3 /100 | #78 | Exceptional $103,423 |
| Armenians | 99.2 /100 | #79 | Exceptional $103,248 |
| Immigrants | Egypt | 99.2 /100 | #80 | Exceptional $103,192 |
| South Africans | 99.2 /100 | #81 | Exceptional $103,160 |
| Immigrants | Serbia | 99.2 /100 | #82 | Exceptional $103,155 |
| Argentineans | 99.1 /100 | #83 | Exceptional $103,111 |
| Immigrants | Philippines | 99.0 /100 | #84 | Exceptional $102,910 |
| Immigrants | Ukraine | 98.9 /100 | #85 | Exceptional $102,664 |
| Immigrants | Hungary | 98.9 /100 | #86 | Exceptional $102,655 |
| Immigrants | Western Europe | 98.9 /100 | #87 | Exceptional $102,654 |
| Immigrants | Canada | 98.9 /100 | #88 | Exceptional $102,616 |