Arapaho vs Maltese 12th Grade, No Diploma
COMPARE
Arapaho
Maltese
12th Grade, No Diploma
12th Grade, No Diploma Comparison
Arapaho
Maltese
90.5%
12TH GRADE, NO DIPLOMA
7.7/ 100
METRIC RATING
215th/ 347
METRIC RANK
93.3%
12TH GRADE, NO DIPLOMA
100.0/ 100
METRIC RATING
16th/ 347
METRIC RANK
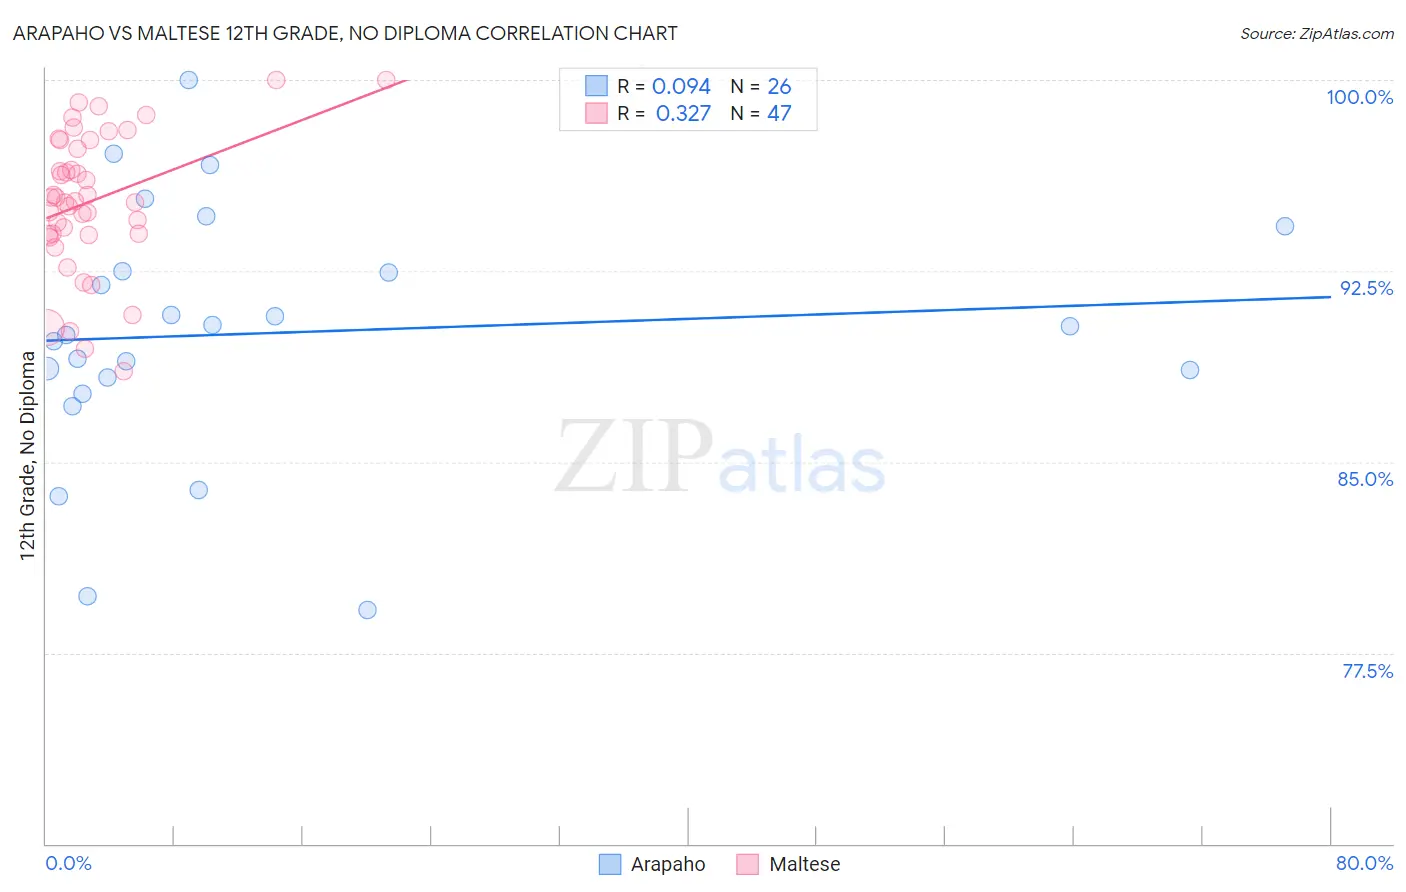
Arapaho vs Maltese 12th Grade, No Diploma Correlation Chart
The statistical analysis conducted on geographies consisting of 29,780,040 people shows a slight positive correlation between the proportion of Arapaho and percentage of population with at least 12th grade (no diploma) education in the United States with a correlation coefficient (R) of 0.094 and weighted average of 90.5%. Similarly, the statistical analysis conducted on geographies consisting of 126,478,003 people shows a mild positive correlation between the proportion of Maltese and percentage of population with at least 12th grade (no diploma) education in the United States with a correlation coefficient (R) of 0.327 and weighted average of 93.3%, a difference of 3.2%.
12th Grade, No Diploma Correlation Summary
| Measurement | Arapaho | Maltese |
| Minimum | 79.2% | 88.6% |
| Maximum | 100.0% | 100.0% |
| Range | 20.8% | 11.4% |
| Mean | 90.1% | 95.2% |
| Median | 90.2% | 95.2% |
| Interquartile 25% (IQ1) | 88.3% | 93.9% |
| Interquartile 75% (IQ3) | 92.5% | 97.6% |
| Interquartile Range (IQR) | 4.2% | 3.7% |
| Standard Deviation (Sample) | 4.9% | 2.7% |
| Standard Deviation (Population) | 4.8% | 2.7% |
Similar Demographics by 12th Grade, No Diploma
Demographics Similar to Arapaho by 12th Grade, No Diploma
In terms of 12th grade, no diploma, the demographic groups most similar to Arapaho are Shoshone (90.5%, a difference of 0.010%), Cherokee (90.5%, a difference of 0.010%), Immigrants from Cameroon (90.5%, a difference of 0.010%), Immigrants from Africa (90.5%, a difference of 0.030%), and Uruguayan (90.4%, a difference of 0.030%).
| Demographics | Rating | Rank | 12th Grade, No Diploma |
| Immigrants | Micronesia | 11.0 /100 | #208 | Poor 90.6% |
| Immigrants | Afghanistan | 11.0 /100 | #209 | Poor 90.6% |
| South American Indians | 10.9 /100 | #210 | Poor 90.6% |
| Portuguese | 10.6 /100 | #211 | Poor 90.6% |
| Somalis | 10.2 /100 | #212 | Poor 90.6% |
| Costa Ricans | 9.4 /100 | #213 | Tragic 90.5% |
| Immigrants | Africa | 8.5 /100 | #214 | Tragic 90.5% |
| Arapaho | 7.7 /100 | #215 | Tragic 90.5% |
| Shoshone | 7.5 /100 | #216 | Tragic 90.5% |
| Cherokee | 7.4 /100 | #217 | Tragic 90.5% |
| Immigrants | Cameroon | 7.4 /100 | #218 | Tragic 90.5% |
| Uruguayans | 7.0 /100 | #219 | Tragic 90.4% |
| Colombians | 6.6 /100 | #220 | Tragic 90.4% |
| Immigrants | Liberia | 5.7 /100 | #221 | Tragic 90.4% |
| Immigrants | Somalia | 5.3 /100 | #222 | Tragic 90.4% |
Demographics Similar to Maltese by 12th Grade, No Diploma
In terms of 12th grade, no diploma, the demographic groups most similar to Maltese are Luxembourger (93.3%, a difference of 0.020%), Finnish (93.4%, a difference of 0.040%), Immigrants from Singapore (93.3%, a difference of 0.050%), German (93.3%, a difference of 0.070%), and Filipino (93.2%, a difference of 0.10%).
| Demographics | Rating | Rank | 12th Grade, No Diploma |
| Latvians | 100.0 /100 | #9 | Exceptional 93.6% |
| Croatians | 100.0 /100 | #10 | Exceptional 93.5% |
| Poles | 100.0 /100 | #11 | Exceptional 93.5% |
| Eastern Europeans | 100.0 /100 | #12 | Exceptional 93.5% |
| Danes | 100.0 /100 | #13 | Exceptional 93.5% |
| Bulgarians | 100.0 /100 | #14 | Exceptional 93.5% |
| Finns | 100.0 /100 | #15 | Exceptional 93.4% |
| Maltese | 100.0 /100 | #16 | Exceptional 93.3% |
| Luxembourgers | 100.0 /100 | #17 | Exceptional 93.3% |
| Immigrants | Singapore | 99.9 /100 | #18 | Exceptional 93.3% |
| Germans | 99.9 /100 | #19 | Exceptional 93.3% |
| Filipinos | 99.9 /100 | #20 | Exceptional 93.2% |
| Italians | 99.9 /100 | #21 | Exceptional 93.2% |
| Estonians | 99.9 /100 | #22 | Exceptional 93.2% |
| Scandinavians | 99.9 /100 | #23 | Exceptional 93.2% |