Apache vs Kiowa Unemployment Among Ages 45 to 54 years
COMPARE
Apache
Kiowa
Unemployment Among Ages 45 to 54 years
Unemployment Among Ages 45 to 54 years Comparison
Apache
Kiowa
7.0%
UNEMPLOYMENT AMONG AGES 45 TO 54 YEARS
0.0/ 100
METRIC RATING
337th/ 347
METRIC RANK
5.1%
UNEMPLOYMENT AMONG AGES 45 TO 54 YEARS
0.0/ 100
METRIC RATING
284th/ 347
METRIC RANK
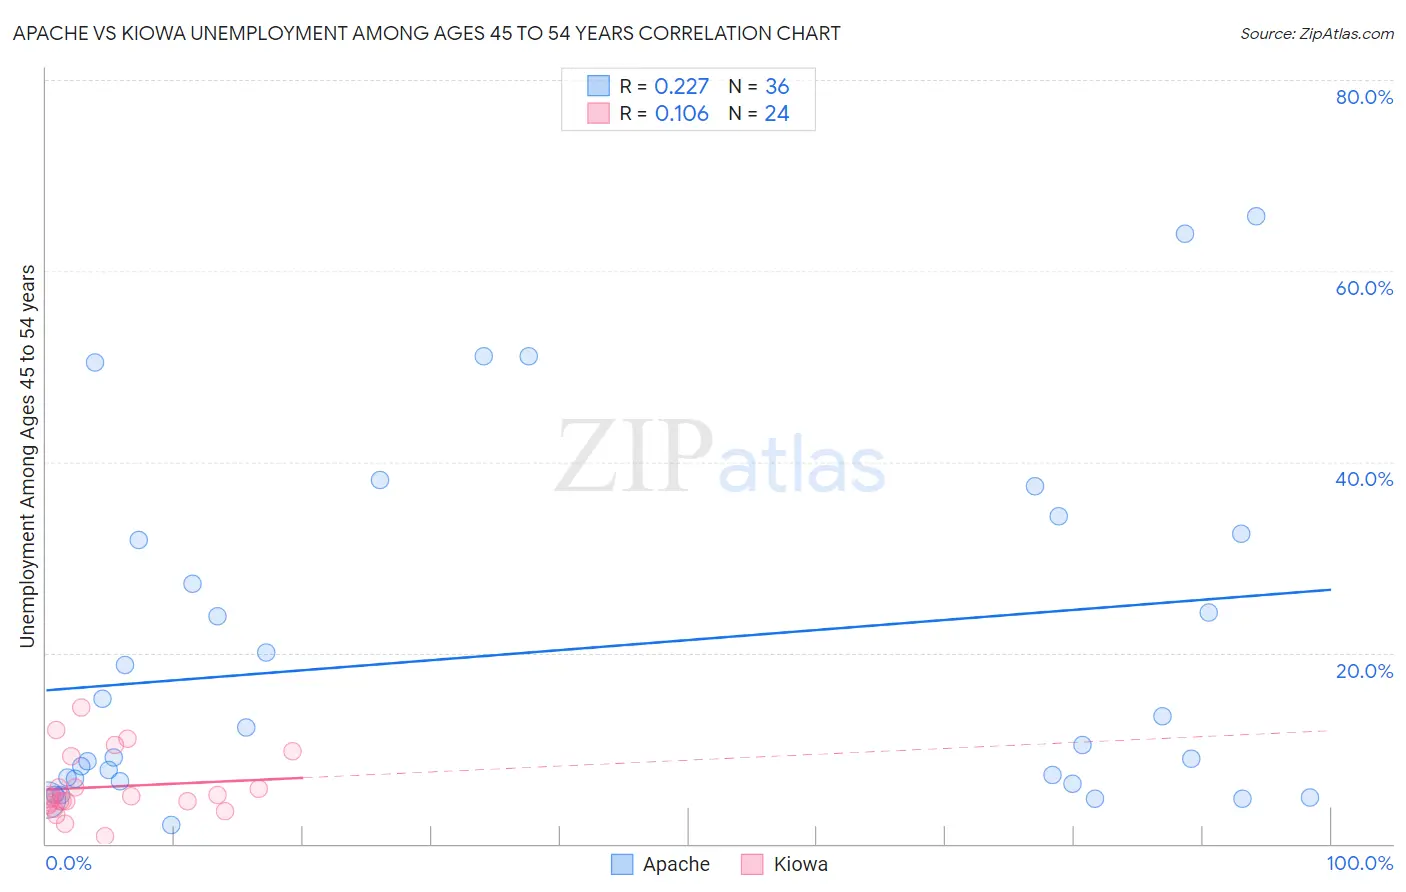
Apache vs Kiowa Unemployment Among Ages 45 to 54 years Correlation Chart
The statistical analysis conducted on geographies consisting of 227,022,431 people shows a weak positive correlation between the proportion of Apache and unemployment rate among population between the ages 45 and 54 in the United States with a correlation coefficient (R) of 0.227 and weighted average of 7.0%. Similarly, the statistical analysis conducted on geographies consisting of 55,688,709 people shows a poor positive correlation between the proportion of Kiowa and unemployment rate among population between the ages 45 and 54 in the United States with a correlation coefficient (R) of 0.106 and weighted average of 5.1%, a difference of 37.2%.
Unemployment Among Ages 45 to 54 years Correlation Summary
| Measurement | Apache | Kiowa |
| Minimum | 1.9% | 0.80% |
| Maximum | 65.7% | 14.3% |
| Range | 63.8% | 13.5% |
| Mean | 20.2% | 6.0% |
| Median | 11.3% | 4.8% |
| Interquartile 25% (IQ1) | 6.7% | 4.2% |
| Interquartile 75% (IQ3) | 32.1% | 7.5% |
| Interquartile Range (IQR) | 25.4% | 3.3% |
| Standard Deviation (Sample) | 18.2% | 3.3% |
| Standard Deviation (Population) | 17.9% | 3.3% |
Similar Demographics by Unemployment Among Ages 45 to 54 years
Demographics Similar to Apache by Unemployment Among Ages 45 to 54 years
In terms of unemployment among ages 45 to 54 years, the demographic groups most similar to Apache are Puerto Rican (6.8%, a difference of 3.4%), Colville (7.4%, a difference of 5.0%), Navajo (6.7%, a difference of 5.6%), Sioux (6.6%, a difference of 6.1%), and Arapaho (7.5%, a difference of 6.5%).
| Demographics | Rating | Rank | Unemployment Among Ages 45 to 54 years |
| Immigrants | Dominican Republic | 0.0 /100 | #330 | Tragic 6.3% |
| Tohono O'odham | 0.0 /100 | #331 | Tragic 6.3% |
| Pima | 0.0 /100 | #332 | Tragic 6.4% |
| Immigrants | Yemen | 0.0 /100 | #333 | Tragic 6.5% |
| Sioux | 0.0 /100 | #334 | Tragic 6.6% |
| Navajo | 0.0 /100 | #335 | Tragic 6.7% |
| Puerto Ricans | 0.0 /100 | #336 | Tragic 6.8% |
| Apache | 0.0 /100 | #337 | Tragic 7.0% |
| Colville | 0.0 /100 | #338 | Tragic 7.4% |
| Arapaho | 0.0 /100 | #339 | Tragic 7.5% |
| Hopi | 0.0 /100 | #340 | Tragic 7.5% |
| Paiute | 0.0 /100 | #341 | Tragic 7.8% |
| Alaskan Athabascans | 0.0 /100 | #342 | Tragic 8.5% |
| Inupiat | 0.0 /100 | #343 | Tragic 9.2% |
| Yuman | 0.0 /100 | #344 | Tragic 9.5% |
Demographics Similar to Kiowa by Unemployment Among Ages 45 to 54 years
In terms of unemployment among ages 45 to 54 years, the demographic groups most similar to Kiowa are Iroquois (5.1%, a difference of 0.020%), Senegalese (5.1%, a difference of 0.18%), Hispanic or Latino (5.1%, a difference of 0.65%), Haitian (5.2%, a difference of 1.0%), and African (5.1%, a difference of 1.1%).
| Demographics | Rating | Rank | Unemployment Among Ages 45 to 54 years |
| Immigrants | Mexico | 0.0 /100 | #277 | Tragic 5.0% |
| Dutch West Indians | 0.0 /100 | #278 | Tragic 5.0% |
| Nepalese | 0.0 /100 | #279 | Tragic 5.0% |
| Blackfeet | 0.0 /100 | #280 | Tragic 5.1% |
| Spanish American Indians | 0.0 /100 | #281 | Tragic 5.1% |
| Africans | 0.0 /100 | #282 | Tragic 5.1% |
| Hispanics or Latinos | 0.0 /100 | #283 | Tragic 5.1% |
| Kiowa | 0.0 /100 | #284 | Tragic 5.1% |
| Iroquois | 0.0 /100 | #285 | Tragic 5.1% |
| Senegalese | 0.0 /100 | #286 | Tragic 5.1% |
| Haitians | 0.0 /100 | #287 | Tragic 5.2% |
| Immigrants | Caribbean | 0.0 /100 | #288 | Tragic 5.2% |
| Immigrants | Haiti | 0.0 /100 | #289 | Tragic 5.2% |
| Immigrants | Portugal | 0.0 /100 | #290 | Tragic 5.2% |
| Armenians | 0.0 /100 | #291 | Tragic 5.2% |