Alaska Native vs Iranian Householder Income Over 65 years
COMPARE
Alaska Native
Iranian
Householder Income Over 65 years
Householder Income Over 65 years Comparison
Alaska Natives
Iranians
$60,748
HOUSEHOLDER INCOME OVER 65 YEARS
44.3/ 100
METRIC RATING
177th/ 347
METRIC RANK
$77,429
HOUSEHOLDER INCOME OVER 65 YEARS
100.0/ 100
METRIC RATING
2nd/ 347
METRIC RANK
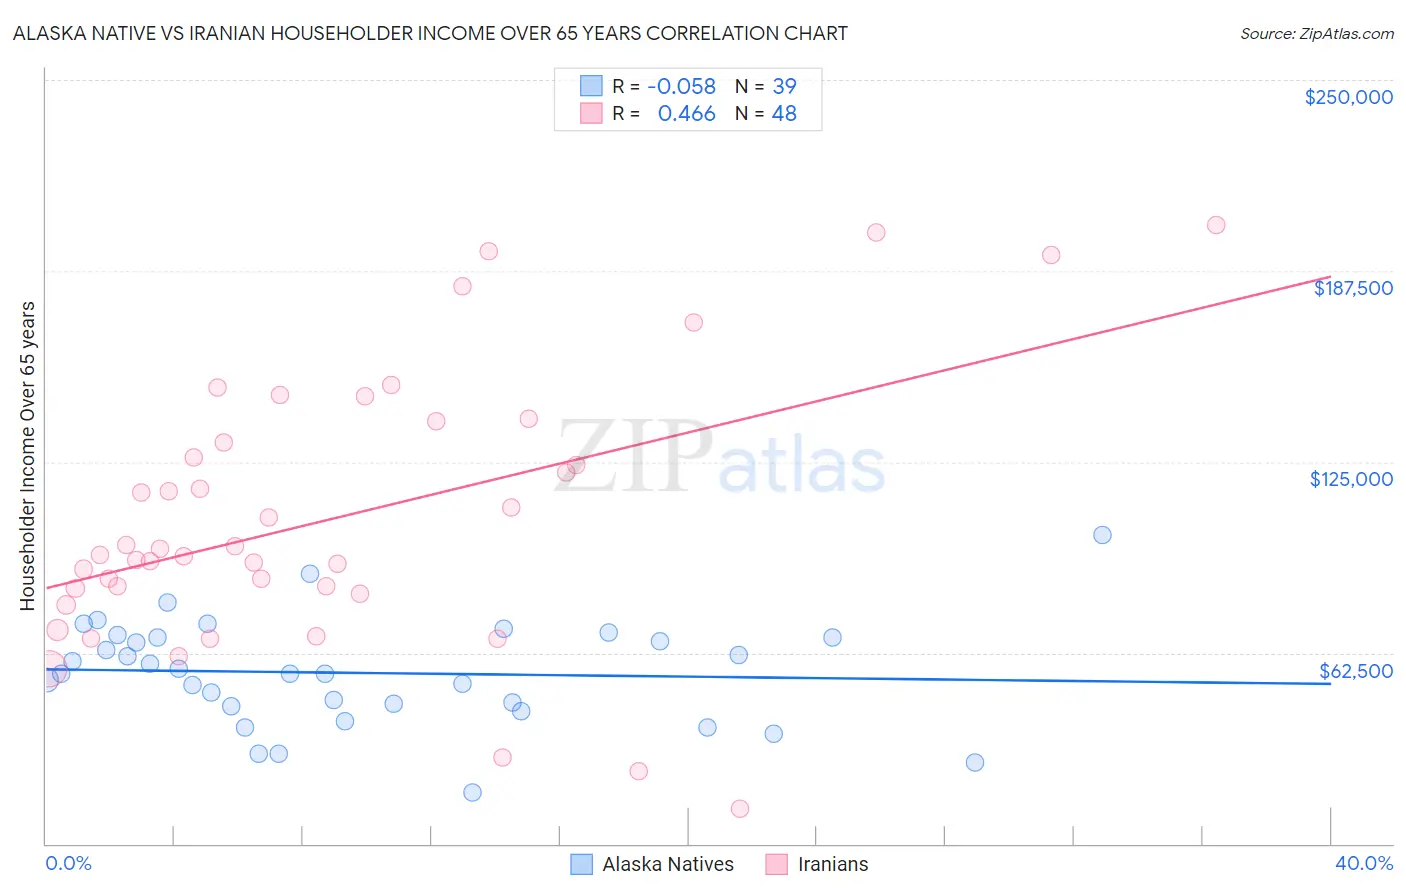
Alaska Native vs Iranian Householder Income Over 65 years Correlation Chart
The statistical analysis conducted on geographies consisting of 76,616,982 people shows a slight negative correlation between the proportion of Alaska Natives and household income with householder over the age of 65 in the United States with a correlation coefficient (R) of -0.058 and weighted average of $60,748. Similarly, the statistical analysis conducted on geographies consisting of 316,043,836 people shows a moderate positive correlation between the proportion of Iranians and household income with householder over the age of 65 in the United States with a correlation coefficient (R) of 0.466 and weighted average of $77,429, a difference of 27.5%.
Householder Income Over 65 years Correlation Summary
| Measurement | Alaska Native | Iranian |
| Minimum | $16,607 | $11,563 |
| Maximum | $101,250 | $202,500 |
| Range | $84,643 | $190,937 |
| Mean | $55,918 | $106,815 |
| Median | $55,808 | $95,602 |
| Interquartile 25% (IQ1) | $45,000 | $82,658 |
| Interquartile 75% (IQ3) | $67,644 | $134,972 |
| Interquartile Range (IQR) | $22,644 | $52,314 |
| Standard Deviation (Sample) | $17,265 | $44,529 |
| Standard Deviation (Population) | $17,043 | $44,062 |
Similar Demographics by Householder Income Over 65 years
Demographics Similar to Alaska Natives by Householder Income Over 65 years
In terms of householder income over 65 years, the demographic groups most similar to Alaska Natives are Yup'ik ($60,727, a difference of 0.030%), Spanish ($60,795, a difference of 0.080%), Welsh ($60,666, a difference of 0.14%), Immigrants from Morocco ($60,647, a difference of 0.17%), and Spaniard ($60,866, a difference of 0.19%).
| Demographics | Rating | Rank | Householder Income Over 65 years |
| Serbians | 53.1 /100 | #170 | Average $61,087 |
| Inupiat | 52.4 /100 | #171 | Average $61,061 |
| Immigrants | Poland | 51.9 /100 | #172 | Average $61,041 |
| Immigrants | Micronesia | 50.8 /100 | #173 | Average $61,000 |
| Luxembourgers | 50.0 /100 | #174 | Average $60,967 |
| Spaniards | 47.3 /100 | #175 | Average $60,866 |
| Spanish | 45.5 /100 | #176 | Average $60,795 |
| Alaska Natives | 44.3 /100 | #177 | Average $60,748 |
| Yup'ik | 43.7 /100 | #178 | Average $60,727 |
| Welsh | 42.2 /100 | #179 | Average $60,666 |
| Immigrants | Morocco | 41.7 /100 | #180 | Average $60,647 |
| Celtics | 40.7 /100 | #181 | Average $60,608 |
| Czechoslovakians | 40.0 /100 | #182 | Average $60,581 |
| Kenyans | 38.4 /100 | #183 | Fair $60,514 |
| Iraqis | 37.2 /100 | #184 | Fair $60,466 |
Demographics Similar to Iranians by Householder Income Over 65 years
In terms of householder income over 65 years, the demographic groups most similar to Iranians are Chinese ($77,465, a difference of 0.050%), Immigrants from Taiwan ($77,051, a difference of 0.49%), Filipino ($76,686, a difference of 0.97%), Immigrants from Iran ($75,081, a difference of 3.1%), and Bolivian ($74,245, a difference of 4.3%).
| Demographics | Rating | Rank | Householder Income Over 65 years |
| Chinese | 100.0 /100 | #1 | Exceptional $77,465 |
| Iranians | 100.0 /100 | #2 | Exceptional $77,429 |
| Immigrants | Taiwan | 100.0 /100 | #3 | Exceptional $77,051 |
| Filipinos | 100.0 /100 | #4 | Exceptional $76,686 |
| Immigrants | Iran | 100.0 /100 | #5 | Exceptional $75,081 |
| Bolivians | 100.0 /100 | #6 | Exceptional $74,245 |
| Immigrants | Bolivia | 100.0 /100 | #7 | Exceptional $73,434 |
| Immigrants | Singapore | 100.0 /100 | #8 | Exceptional $72,963 |
| Immigrants | India | 100.0 /100 | #9 | Exceptional $72,804 |
| Bhutanese | 100.0 /100 | #10 | Exceptional $72,288 |
| Thais | 100.0 /100 | #11 | Exceptional $72,099 |
| Cypriots | 100.0 /100 | #12 | Exceptional $71,714 |
| Immigrants | Hong Kong | 100.0 /100 | #13 | Exceptional $71,567 |
| Burmese | 100.0 /100 | #14 | Exceptional $71,139 |
| Native Hawaiians | 100.0 /100 | #15 | Exceptional $71,021 |