Ute vs Spaniard Family Households with Children
COMPARE
Ute
Spaniard
Family Households with Children
Family Households with Children Comparison
Ute
Spaniards
28.2%
FAMILY HOUSEHOLDS WITH CHILDREN
99.1/ 100
METRIC RATING
96th/ 347
METRIC RANK
28.0%
FAMILY HOUSEHOLDS WITH CHILDREN
97.4/ 100
METRIC RATING
110th/ 347
METRIC RANK
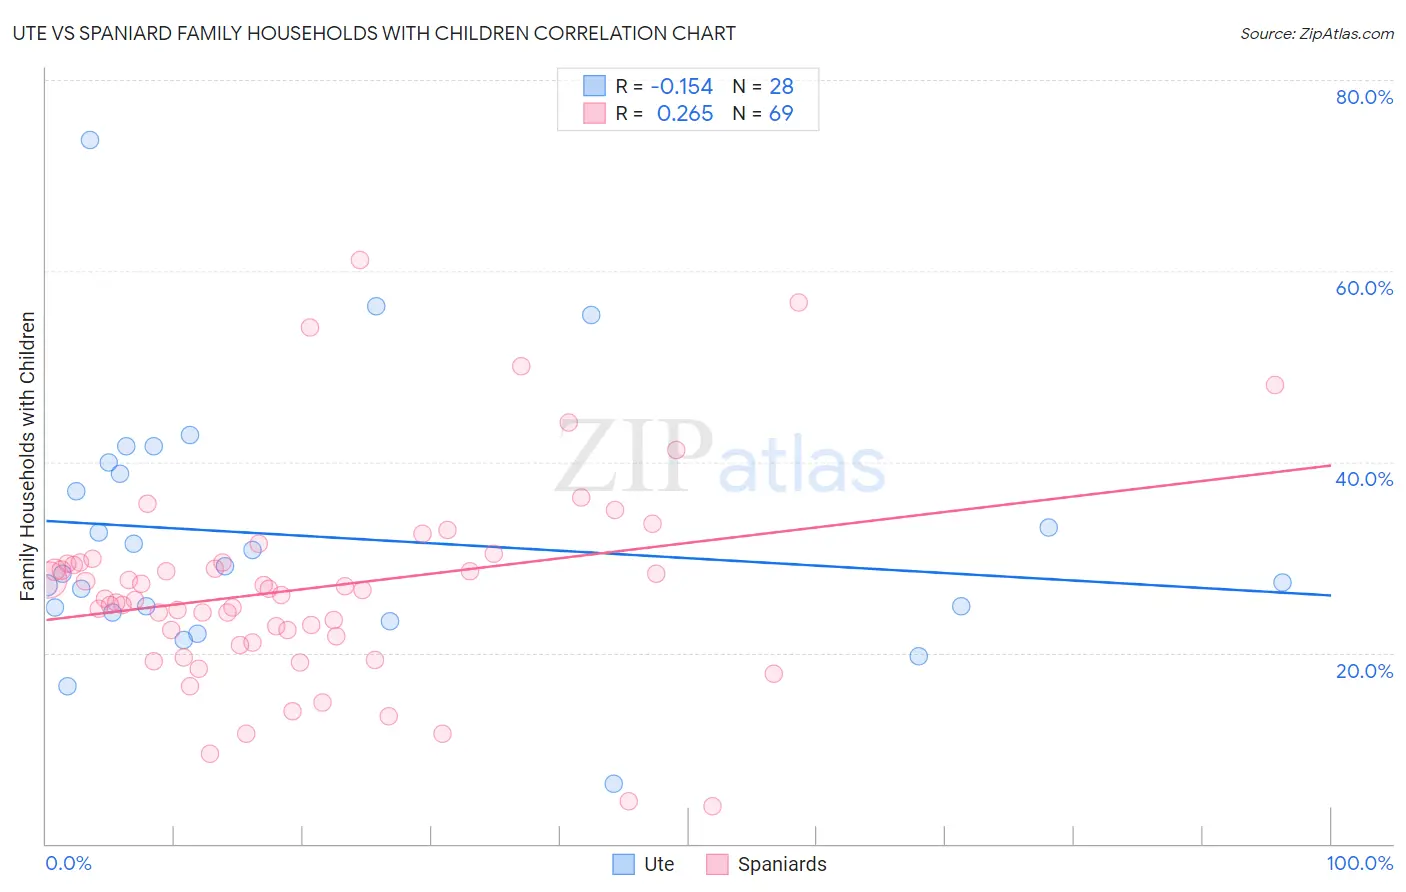
Ute vs Spaniard Family Households with Children Correlation Chart
The statistical analysis conducted on geographies consisting of 55,657,508 people shows a poor negative correlation between the proportion of Ute and percentage of family households with children in the United States with a correlation coefficient (R) of -0.154 and weighted average of 28.2%. Similarly, the statistical analysis conducted on geographies consisting of 442,990,827 people shows a weak positive correlation between the proportion of Spaniards and percentage of family households with children in the United States with a correlation coefficient (R) of 0.265 and weighted average of 28.0%, a difference of 0.54%.
Family Households with Children Correlation Summary
| Measurement | Ute | Spaniard |
| Minimum | 6.3% | 3.9% |
| Maximum | 73.7% | 61.2% |
| Range | 67.4% | 57.3% |
| Mean | 32.2% | 26.8% |
| Median | 28.7% | 26.1% |
| Interquartile 25% (IQ1) | 24.5% | 21.4% |
| Interquartile 75% (IQ3) | 39.3% | 29.5% |
| Interquartile Range (IQR) | 14.9% | 8.0% |
| Standard Deviation (Sample) | 13.6% | 10.7% |
| Standard Deviation (Population) | 13.3% | 10.6% |
Demographics Similar to Ute and Spaniards by Family Households with Children
In terms of family households with children, the demographic groups most similar to Ute are Immigrants from Nicaragua (28.2%, a difference of 0.020%), Chilean (28.1%, a difference of 0.060%), Immigrants from Colombia (28.2%, a difference of 0.090%), Immigrants from Kenya (28.1%, a difference of 0.10%), and Immigrants from the Azores (28.1%, a difference of 0.11%). Similarly, the demographic groups most similar to Spaniards are Tohono O'odham (28.0%, a difference of 0.040%), Immigrants from Burma/Myanmar (28.0%, a difference of 0.050%), Immigrants from Uganda (28.0%, a difference of 0.060%), Scandinavian (28.0%, a difference of 0.060%), and Immigrants from Middle Africa (28.0%, a difference of 0.090%).
| Demographics | Rating | Rank | Family Households with Children |
| Panamanians | 99.3 /100 | #93 | Exceptional 28.2% |
| Immigrants | Colombia | 99.2 /100 | #94 | Exceptional 28.2% |
| Immigrants | Nicaragua | 99.1 /100 | #95 | Exceptional 28.2% |
| Ute | 99.1 /100 | #96 | Exceptional 28.2% |
| Chileans | 98.9 /100 | #97 | Exceptional 28.1% |
| Immigrants | Kenya | 98.9 /100 | #98 | Exceptional 28.1% |
| Immigrants | Azores | 98.8 /100 | #99 | Exceptional 28.1% |
| Indonesians | 98.8 /100 | #100 | Exceptional 28.1% |
| Immigrants | Oceania | 98.8 /100 | #101 | Exceptional 28.1% |
| Assyrians/Chaldeans/Syriacs | 98.7 /100 | #102 | Exceptional 28.1% |
| Palestinians | 98.5 /100 | #103 | Exceptional 28.1% |
| Sioux | 98.3 /100 | #104 | Exceptional 28.1% |
| Choctaw | 98.3 /100 | #105 | Exceptional 28.1% |
| Immigrants | South America | 98.0 /100 | #106 | Exceptional 28.0% |
| Immigrants | Uganda | 97.7 /100 | #107 | Exceptional 28.0% |
| Immigrants | Burma/Myanmar | 97.7 /100 | #108 | Exceptional 28.0% |
| Tohono O'odham | 97.6 /100 | #109 | Exceptional 28.0% |
| Spaniards | 97.4 /100 | #110 | Exceptional 28.0% |
| Scandinavians | 97.1 /100 | #111 | Exceptional 28.0% |
| Immigrants | Middle Africa | 97.0 /100 | #112 | Exceptional 28.0% |
| Arabs | 97.0 /100 | #113 | Exceptional 28.0% |