Ugandan vs Immigrants from Dominican Republic Married-couple Households
COMPARE
Ugandan
Immigrants from Dominican Republic
Married-couple Households
Married-couple Households Comparison
Ugandans
Immigrants from Dominican Republic
43.8%
MARRIED-COUPLE HOUSEHOLDS
0.3/ 100
METRIC RATING
256th/ 347
METRIC RANK
37.3%
MARRIED-COUPLE HOUSEHOLDS
0.0/ 100
METRIC RATING
344th/ 347
METRIC RANK
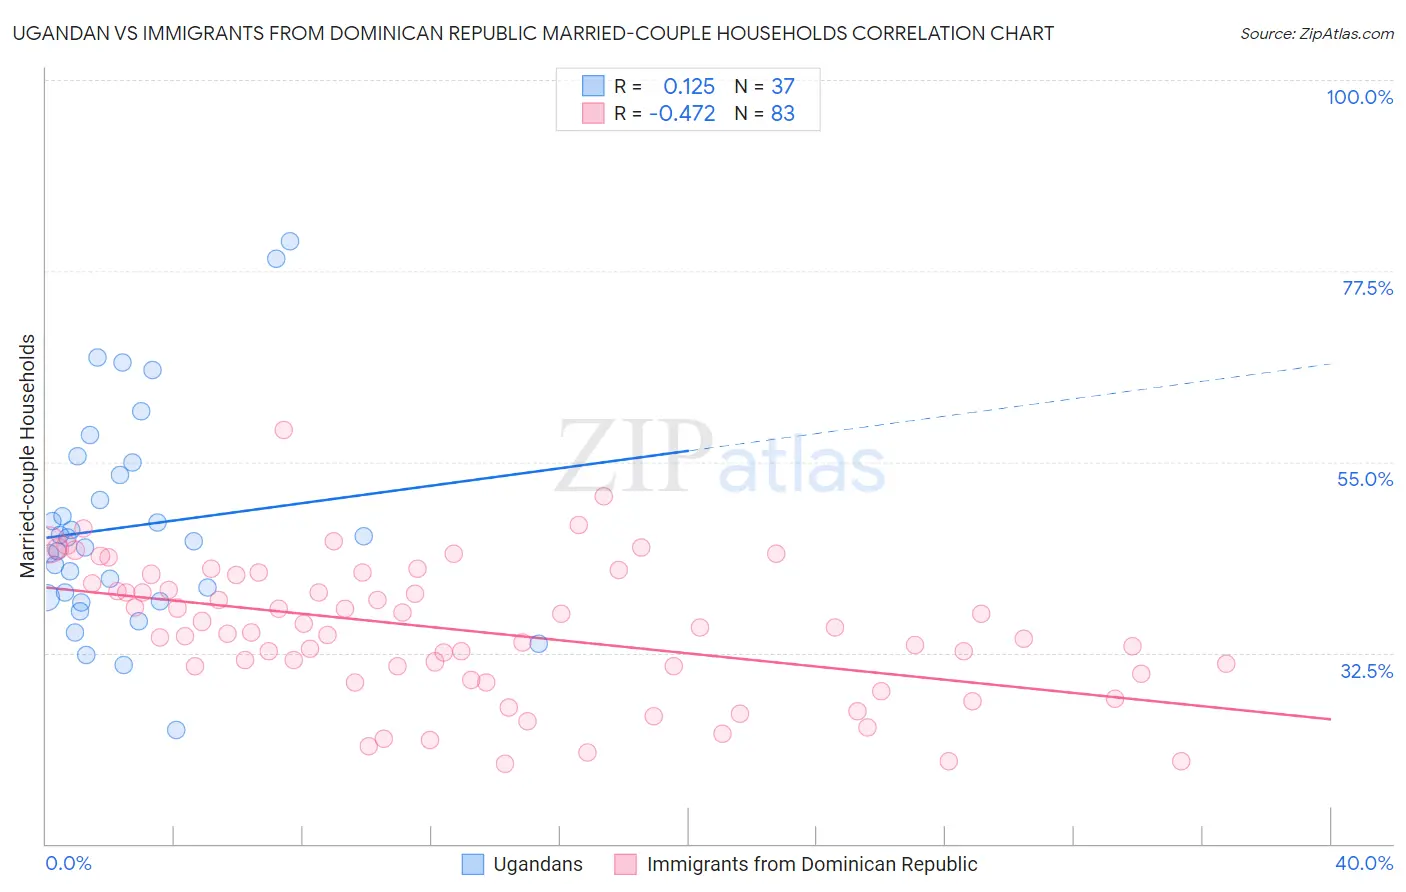
Ugandan vs Immigrants from Dominican Republic Married-couple Households Correlation Chart
The statistical analysis conducted on geographies consisting of 93,998,948 people shows a poor positive correlation between the proportion of Ugandans and percentage of married-couple family households in the United States with a correlation coefficient (R) of 0.125 and weighted average of 43.8%. Similarly, the statistical analysis conducted on geographies consisting of 274,963,123 people shows a moderate negative correlation between the proportion of Immigrants from Dominican Republic and percentage of married-couple family households in the United States with a correlation coefficient (R) of -0.472 and weighted average of 37.3%, a difference of 17.4%.
Married-couple Households Correlation Summary
| Measurement | Ugandan | Immigrants from Dominican Republic |
| Minimum | 23.4% | 19.5% |
| Maximum | 81.0% | 58.7% |
| Range | 57.6% | 39.3% |
| Mean | 47.4% | 35.1% |
| Median | 45.6% | 34.9% |
| Interquartile 25% (IQ1) | 38.8% | 30.0% |
| Interquartile 75% (IQ3) | 54.2% | 41.6% |
| Interquartile Range (IQR) | 15.3% | 11.6% |
| Standard Deviation (Sample) | 12.7% | 8.0% |
| Standard Deviation (Population) | 12.5% | 7.9% |
Similar Demographics by Married-couple Households
Demographics Similar to Ugandans by Married-couple Households
In terms of married-couple households, the demographic groups most similar to Ugandans are Shoshone (43.9%, a difference of 0.14%), Apache (43.9%, a difference of 0.16%), Blackfeet (43.8%, a difference of 0.16%), Central American Indian (43.8%, a difference of 0.20%), and Central American (43.9%, a difference of 0.21%).
| Demographics | Rating | Rank | Married-couple Households |
| Immigrants | Kenya | 0.4 /100 | #249 | Tragic 44.1% |
| French American Indians | 0.4 /100 | #250 | Tragic 44.1% |
| German Russians | 0.4 /100 | #251 | Tragic 44.0% |
| Seminole | 0.4 /100 | #252 | Tragic 44.0% |
| Central Americans | 0.3 /100 | #253 | Tragic 43.9% |
| Apache | 0.3 /100 | #254 | Tragic 43.9% |
| Shoshone | 0.3 /100 | #255 | Tragic 43.9% |
| Ugandans | 0.3 /100 | #256 | Tragic 43.8% |
| Blackfeet | 0.2 /100 | #257 | Tragic 43.8% |
| Central American Indians | 0.2 /100 | #258 | Tragic 43.8% |
| Iroquois | 0.2 /100 | #259 | Tragic 43.7% |
| Immigrants | Cameroon | 0.2 /100 | #260 | Tragic 43.7% |
| Alaskan Athabascans | 0.2 /100 | #261 | Tragic 43.6% |
| Vietnamese | 0.2 /100 | #262 | Tragic 43.6% |
| Cree | 0.1 /100 | #263 | Tragic 43.6% |
Demographics Similar to Immigrants from Dominican Republic by Married-couple Households
In terms of married-couple households, the demographic groups most similar to Immigrants from Dominican Republic are Immigrants from Grenada (37.5%, a difference of 0.43%), Tohono O'odham (37.9%, a difference of 1.5%), Hopi (36.7%, a difference of 1.8%), Cape Verdean (38.1%, a difference of 2.1%), and Dominican (38.2%, a difference of 2.2%).
| Demographics | Rating | Rank | Married-couple Households |
| Immigrants | West Indies | 0.0 /100 | #333 | Tragic 39.0% |
| Immigrants | St. Vincent and the Grenadines | 0.0 /100 | #334 | Tragic 38.7% |
| Senegalese | 0.0 /100 | #335 | Tragic 38.6% |
| Blacks/African Americans | 0.0 /100 | #336 | Tragic 38.5% |
| Immigrants | Somalia | 0.0 /100 | #337 | Tragic 38.4% |
| Immigrants | Senegal | 0.0 /100 | #338 | Tragic 38.4% |
| British West Indians | 0.0 /100 | #339 | Tragic 38.3% |
| Dominicans | 0.0 /100 | #340 | Tragic 38.2% |
| Cape Verdeans | 0.0 /100 | #341 | Tragic 38.1% |
| Tohono O'odham | 0.0 /100 | #342 | Tragic 37.9% |
| Immigrants | Grenada | 0.0 /100 | #343 | Tragic 37.5% |
| Immigrants | Dominican Republic | 0.0 /100 | #344 | Tragic 37.3% |
| Hopi | 0.0 /100 | #345 | Tragic 36.7% |
| Immigrants | Cabo Verde | 0.0 /100 | #346 | Tragic 36.2% |
| Pima | 0.0 /100 | #347 | Tragic 35.6% |