Tongan vs Croatian Family Households with Children
COMPARE
Tongan
Croatian
Family Households with Children
Family Households with Children Comparison
Tongans
Croatians
31.2%
FAMILY HOUSEHOLDS WITH CHILDREN
100.0/ 100
METRIC RATING
5th/ 347
METRIC RANK
26.4%
FAMILY HOUSEHOLDS WITH CHILDREN
0.1/ 100
METRIC RATING
296th/ 347
METRIC RANK
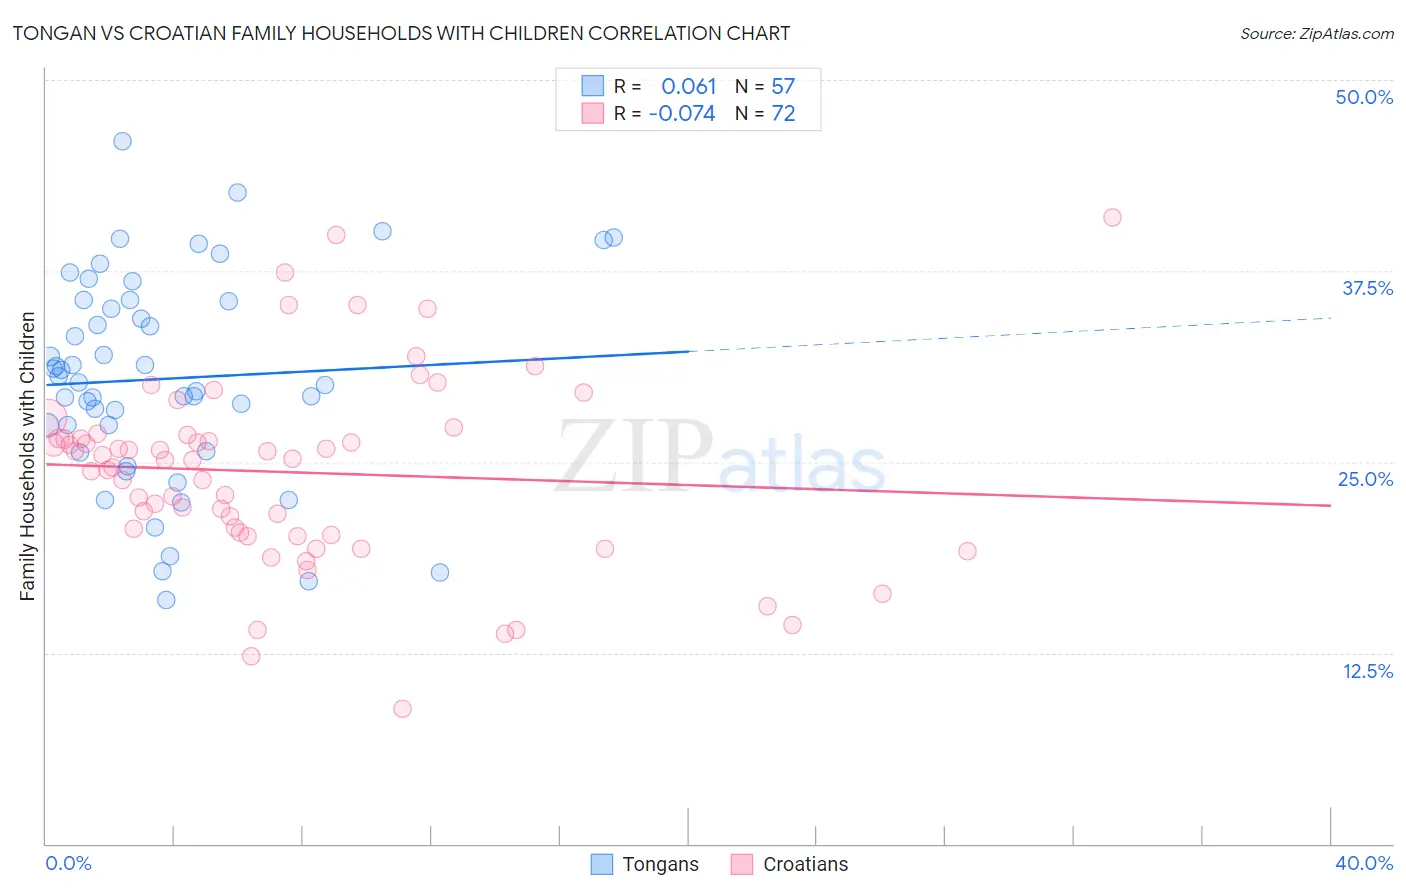
Tongan vs Croatian Family Households with Children Correlation Chart
The statistical analysis conducted on geographies consisting of 102,857,266 people shows a slight positive correlation between the proportion of Tongans and percentage of family households with children in the United States with a correlation coefficient (R) of 0.061 and weighted average of 31.2%. Similarly, the statistical analysis conducted on geographies consisting of 375,401,483 people shows a slight negative correlation between the proportion of Croatians and percentage of family households with children in the United States with a correlation coefficient (R) of -0.074 and weighted average of 26.4%, a difference of 18.2%.
Family Households with Children Correlation Summary
| Measurement | Tongan | Croatian |
| Minimum | 15.9% | 8.8% |
| Maximum | 46.0% | 41.0% |
| Range | 30.1% | 32.2% |
| Mean | 30.4% | 24.3% |
| Median | 30.2% | 25.1% |
| Interquartile 25% (IQ1) | 26.6% | 20.3% |
| Interquartile 75% (IQ3) | 35.5% | 26.6% |
| Interquartile Range (IQR) | 9.0% | 6.3% |
| Standard Deviation (Sample) | 6.8% | 6.2% |
| Standard Deviation (Population) | 6.7% | 6.2% |
Similar Demographics by Family Households with Children
Demographics Similar to Tongans by Family Households with Children
In terms of family households with children, the demographic groups most similar to Tongans are Mexican (31.4%, a difference of 0.41%), Immigrants from India (31.0%, a difference of 0.62%), Immigrants from Central America (31.0%, a difference of 0.91%), Immigrants from Mexico (31.6%, a difference of 1.2%), and Yakama (30.8%, a difference of 1.5%).
| Demographics | Rating | Rank | Family Households with Children |
| Yup'ik | 100 /100 | #1 | Exceptional 37.0% |
| Inupiat | 100 /100 | #2 | Exceptional 32.8% |
| Immigrants | Mexico | 100.0 /100 | #3 | Exceptional 31.6% |
| Mexicans | 100.0 /100 | #4 | Exceptional 31.4% |
| Tongans | 100.0 /100 | #5 | Exceptional 31.2% |
| Immigrants | India | 100.0 /100 | #6 | Exceptional 31.0% |
| Immigrants | Central America | 100.0 /100 | #7 | Exceptional 31.0% |
| Yakama | 100.0 /100 | #8 | Exceptional 30.8% |
| Thais | 100.0 /100 | #9 | Exceptional 30.6% |
| Immigrants | Fiji | 100.0 /100 | #10 | Exceptional 30.5% |
| Nepalese | 100.0 /100 | #11 | Exceptional 30.5% |
| Immigrants | Pakistan | 100.0 /100 | #12 | Exceptional 30.2% |
| Afghans | 100.0 /100 | #13 | Exceptional 30.2% |
| Bangladeshis | 100.0 /100 | #14 | Exceptional 30.1% |
| Immigrants | South Central Asia | 100.0 /100 | #15 | Exceptional 30.0% |
Demographics Similar to Croatians by Family Households with Children
In terms of family households with children, the demographic groups most similar to Croatians are Armenian (26.4%, a difference of 0.010%), Macedonian (26.4%, a difference of 0.020%), Latvian (26.4%, a difference of 0.10%), Immigrants from Western Europe (26.4%, a difference of 0.11%), and Trinidadian and Tobagonian (26.4%, a difference of 0.12%).
| Demographics | Rating | Rank | Family Households with Children |
| Immigrants | Sweden | 0.2 /100 | #289 | Tragic 26.5% |
| Albanians | 0.2 /100 | #290 | Tragic 26.5% |
| Bahamians | 0.2 /100 | #291 | Tragic 26.5% |
| Poles | 0.2 /100 | #292 | Tragic 26.5% |
| Blacks/African Americans | 0.1 /100 | #293 | Tragic 26.5% |
| Latvians | 0.1 /100 | #294 | Tragic 26.4% |
| Macedonians | 0.1 /100 | #295 | Tragic 26.4% |
| Croatians | 0.1 /100 | #296 | Tragic 26.4% |
| Armenians | 0.1 /100 | #297 | Tragic 26.4% |
| Immigrants | Western Europe | 0.1 /100 | #298 | Tragic 26.4% |
| Trinidadians and Tobagonians | 0.1 /100 | #299 | Tragic 26.4% |
| Paiute | 0.1 /100 | #300 | Tragic 26.4% |
| Immigrants | Trinidad and Tobago | 0.1 /100 | #301 | Tragic 26.4% |
| Serbians | 0.1 /100 | #302 | Tragic 26.4% |
| Immigrants | Guyana | 0.1 /100 | #303 | Tragic 26.3% |