Swiss vs Ute Single Mother Households
COMPARE
Swiss
Ute
Single Mother Households
Single Mother Households Comparison
Swiss
Ute
5.6%
SINGLE MOTHER HOUSEHOLDS
98.1/ 100
METRIC RATING
78th/ 347
METRIC RANK
7.1%
SINGLE MOTHER HOUSEHOLDS
1.0/ 100
METRIC RATING
236th/ 347
METRIC RANK
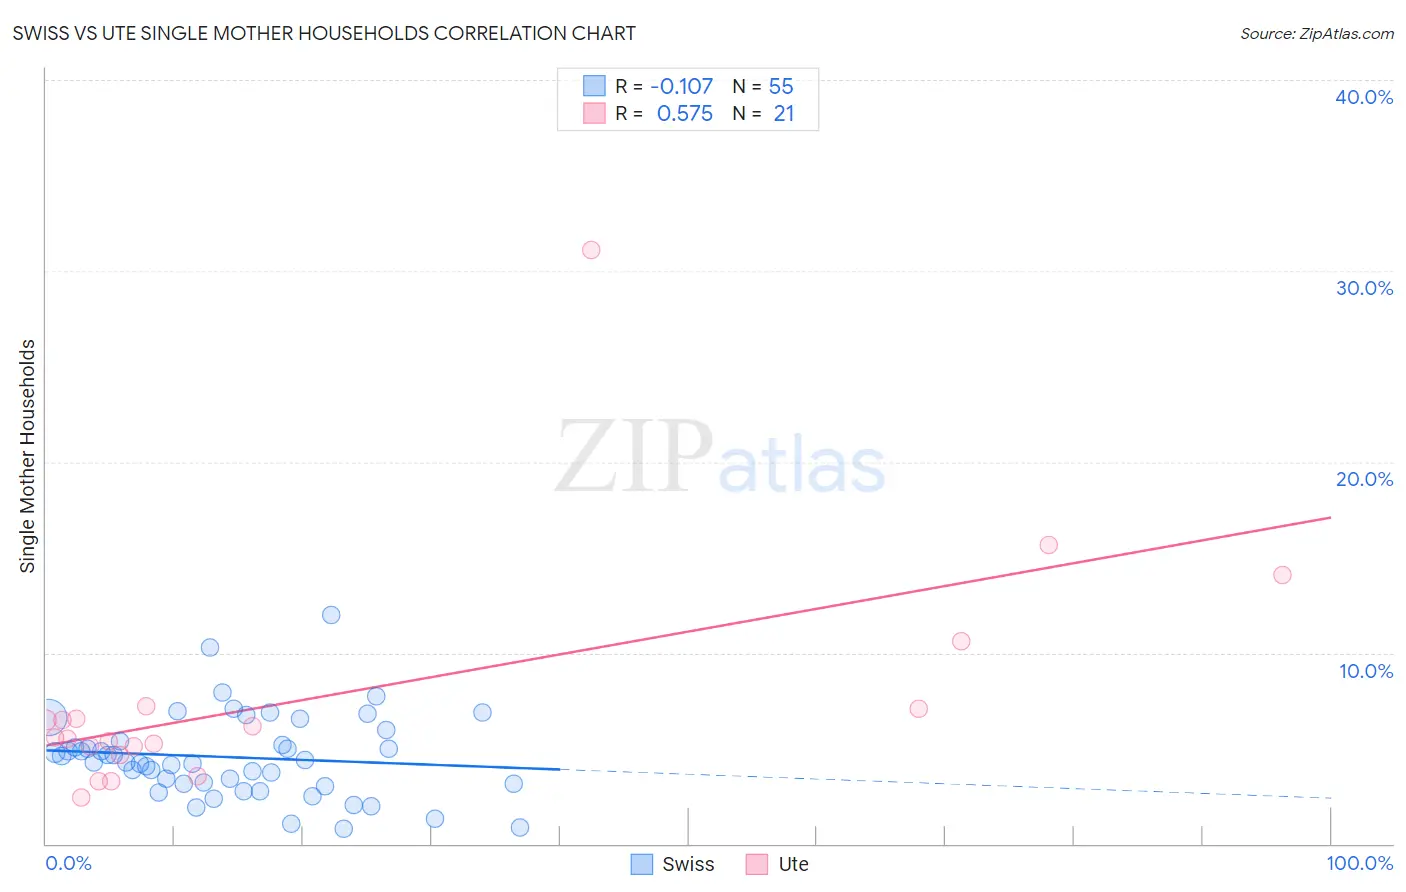
Swiss vs Ute Single Mother Households Correlation Chart
The statistical analysis conducted on geographies consisting of 462,653,045 people shows a poor negative correlation between the proportion of Swiss and percentage of single mother households in the United States with a correlation coefficient (R) of -0.107 and weighted average of 5.6%. Similarly, the statistical analysis conducted on geographies consisting of 55,640,483 people shows a substantial positive correlation between the proportion of Ute and percentage of single mother households in the United States with a correlation coefficient (R) of 0.575 and weighted average of 7.1%, a difference of 26.2%.
Single Mother Households Correlation Summary
| Measurement | Swiss | Ute |
| Minimum | 0.79% | 2.4% |
| Maximum | 12.0% | 31.1% |
| Range | 11.2% | 28.6% |
| Mean | 4.5% | 7.6% |
| Median | 4.3% | 5.6% |
| Interquartile 25% (IQ1) | 3.1% | 4.9% |
| Interquartile 75% (IQ3) | 5.4% | 7.1% |
| Interquartile Range (IQR) | 2.2% | 2.3% |
| Standard Deviation (Sample) | 2.2% | 6.3% |
| Standard Deviation (Population) | 2.2% | 6.1% |
Similar Demographics by Single Mother Households
Demographics Similar to Swiss by Single Mother Households
In terms of single mother households, the demographic groups most similar to Swiss are Romanian (5.6%, a difference of 0.0%), New Zealander (5.6%, a difference of 0.19%), Immigrants from Sri Lanka (5.6%, a difference of 0.20%), Slovene (5.6%, a difference of 0.26%), and Czech (5.6%, a difference of 0.31%).
| Demographics | Rating | Rank | Single Mother Households |
| Immigrants | Kazakhstan | 98.4 /100 | #71 | Exceptional 5.6% |
| Immigrants | Netherlands | 98.4 /100 | #72 | Exceptional 5.6% |
| Immigrants | Asia | 98.4 /100 | #73 | Exceptional 5.6% |
| Immigrants | North America | 98.3 /100 | #74 | Exceptional 5.6% |
| Slovenes | 98.3 /100 | #75 | Exceptional 5.6% |
| New Zealanders | 98.2 /100 | #76 | Exceptional 5.6% |
| Romanians | 98.1 /100 | #77 | Exceptional 5.6% |
| Swiss | 98.1 /100 | #78 | Exceptional 5.6% |
| Immigrants | Sri Lanka | 98.0 /100 | #79 | Exceptional 5.6% |
| Czechs | 97.9 /100 | #80 | Exceptional 5.6% |
| Immigrants | Moldova | 97.9 /100 | #81 | Exceptional 5.6% |
| Immigrants | Malaysia | 97.8 /100 | #82 | Exceptional 5.7% |
| Immigrants | Hungary | 97.8 /100 | #83 | Exceptional 5.7% |
| Carpatho Rusyns | 97.7 /100 | #84 | Exceptional 5.7% |
| Hungarians | 97.6 /100 | #85 | Exceptional 5.7% |
Demographics Similar to Ute by Single Mother Households
In terms of single mother households, the demographic groups most similar to Ute are Arapaho (7.1%, a difference of 0.090%), Panamanian (7.1%, a difference of 0.23%), Kiowa (7.1%, a difference of 0.50%), Immigrants from Burma/Myanmar (7.0%, a difference of 0.79%), and Immigrants from Panama (7.2%, a difference of 0.82%).
| Demographics | Rating | Rank | Single Mother Households |
| Immigrants | Kenya | 2.1 /100 | #229 | Tragic 7.0% |
| Creek | 1.6 /100 | #230 | Tragic 7.0% |
| Spanish Americans | 1.6 /100 | #231 | Tragic 7.0% |
| Comanche | 1.5 /100 | #232 | Tragic 7.0% |
| Choctaw | 1.4 /100 | #233 | Tragic 7.0% |
| Chickasaw | 1.4 /100 | #234 | Tragic 7.0% |
| Immigrants | Burma/Myanmar | 1.4 /100 | #235 | Tragic 7.0% |
| Ute | 1.0 /100 | #236 | Tragic 7.1% |
| Arapaho | 1.0 /100 | #237 | Tragic 7.1% |
| Panamanians | 0.9 /100 | #238 | Tragic 7.1% |
| Kiowa | 0.8 /100 | #239 | Tragic 7.1% |
| Immigrants | Panama | 0.7 /100 | #240 | Tragic 7.2% |
| Immigrants | Portugal | 0.6 /100 | #241 | Tragic 7.2% |
| Fijians | 0.6 /100 | #242 | Tragic 7.2% |
| Ecuadorians | 0.6 /100 | #243 | Tragic 7.2% |