Spanish vs South American Family Households with Children
COMPARE
Spanish
South American
Family Households with Children
Family Households with Children Comparison
Spanish
South Americans
27.7%
FAMILY HOUSEHOLDS WITH CHILDREN
81.8/ 100
METRIC RATING
140th/ 347
METRIC RANK
28.4%
FAMILY HOUSEHOLDS WITH CHILDREN
99.8/ 100
METRIC RATING
81st/ 347
METRIC RANK
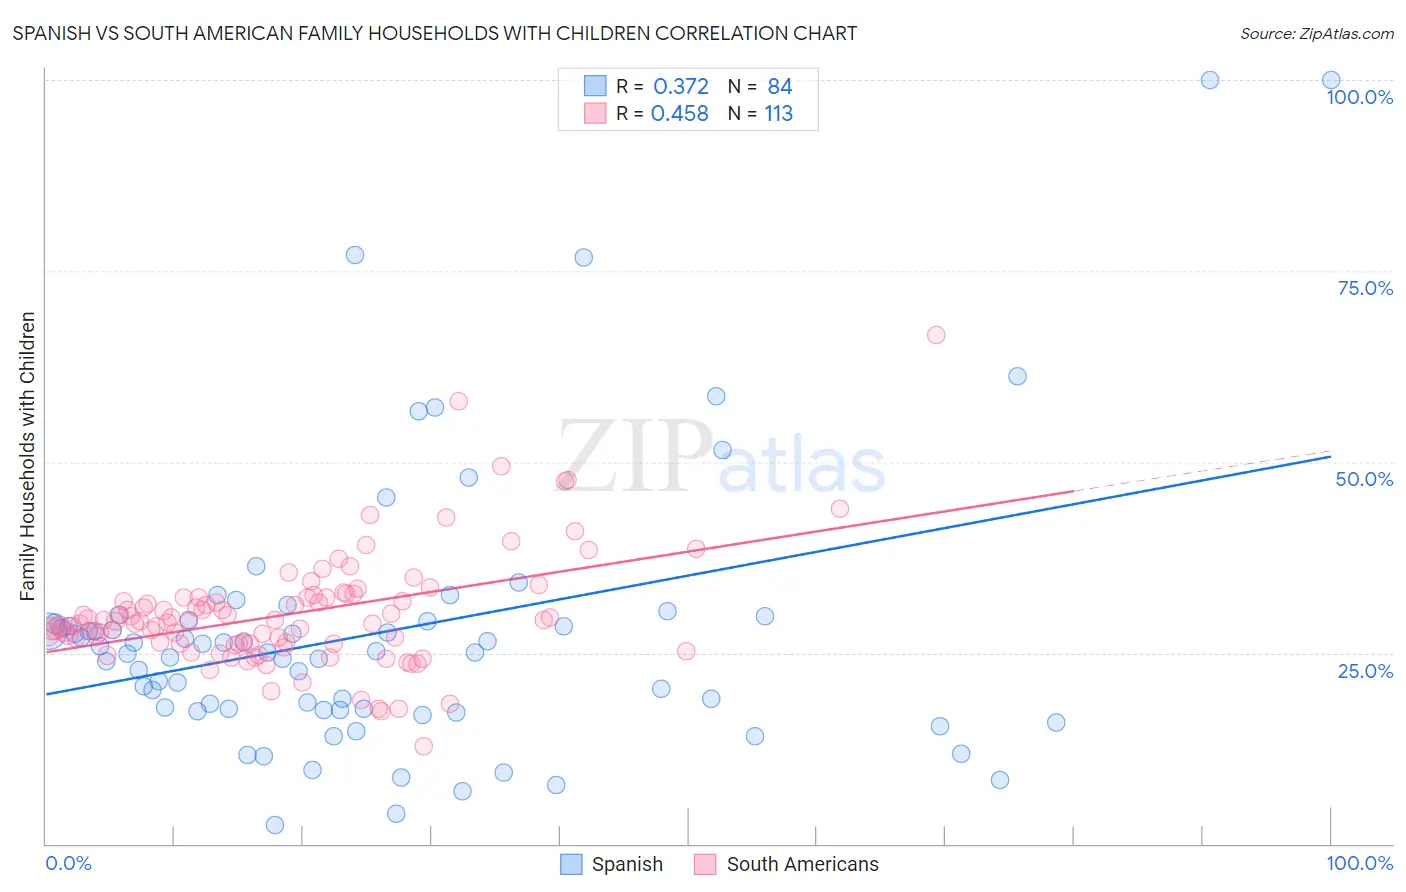
Spanish vs South American Family Households with Children Correlation Chart
The statistical analysis conducted on geographies consisting of 421,743,519 people shows a mild positive correlation between the proportion of Spanish and percentage of family households with children in the United States with a correlation coefficient (R) of 0.372 and weighted average of 27.7%. Similarly, the statistical analysis conducted on geographies consisting of 493,371,298 people shows a moderate positive correlation between the proportion of South Americans and percentage of family households with children in the United States with a correlation coefficient (R) of 0.458 and weighted average of 28.4%, a difference of 2.6%.
Family Households with Children Correlation Summary
| Measurement | Spanish | South American |
| Minimum | 2.5% | 12.7% |
| Maximum | 100.0% | 66.7% |
| Range | 97.5% | 53.9% |
| Mean | 27.7% | 30.1% |
| Median | 25.1% | 29.1% |
| Interquartile 25% (IQ1) | 17.6% | 26.2% |
| Interquartile 75% (IQ3) | 29.2% | 32.2% |
| Interquartile Range (IQR) | 11.6% | 6.0% |
| Standard Deviation (Sample) | 18.1% | 7.6% |
| Standard Deviation (Population) | 18.0% | 7.5% |
Similar Demographics by Family Households with Children
Demographics Similar to Spanish by Family Households with Children
In terms of family households with children, the demographic groups most similar to Spanish are Immigrants from Eastern Asia (27.7%, a difference of 0.0%), Swiss (27.7%, a difference of 0.020%), Vietnamese (27.7%, a difference of 0.030%), Uruguayan (27.7%, a difference of 0.050%), and Immigrants from Eastern Africa (27.7%, a difference of 0.060%).
| Demographics | Rating | Rank | Family Households with Children |
| Iranians | 85.2 /100 | #133 | Excellent 27.7% |
| Immigrants | Panama | 84.9 /100 | #134 | Excellent 27.7% |
| Immigrants | Ecuador | 84.6 /100 | #135 | Excellent 27.7% |
| Immigrants | Portugal | 84.1 /100 | #136 | Excellent 27.7% |
| Immigrants | Dominican Republic | 83.9 /100 | #137 | Excellent 27.7% |
| Uruguayans | 83.2 /100 | #138 | Excellent 27.7% |
| Vietnamese | 82.6 /100 | #139 | Excellent 27.7% |
| Spanish | 81.8 /100 | #140 | Excellent 27.7% |
| Immigrants | Eastern Asia | 81.7 /100 | #141 | Excellent 27.7% |
| Swiss | 81.4 /100 | #142 | Excellent 27.7% |
| Immigrants | Eastern Africa | 80.2 /100 | #143 | Excellent 27.7% |
| Brazilians | 79.6 /100 | #144 | Good 27.7% |
| Immigrants | Chile | 79.5 /100 | #145 | Good 27.7% |
| Basques | 79.5 /100 | #146 | Good 27.7% |
| Immigrants | Moldova | 79.1 /100 | #147 | Good 27.6% |
Demographics Similar to South Americans by Family Households with Children
In terms of family households with children, the demographic groups most similar to South Americans are Native/Alaskan (28.4%, a difference of 0.020%), Immigrants from Iraq (28.4%, a difference of 0.040%), Kenyan (28.4%, a difference of 0.040%), Immigrants from Nepal (28.4%, a difference of 0.060%), and Nicaraguan (28.4%, a difference of 0.090%).
| Demographics | Rating | Rank | Family Households with Children |
| Laotians | 99.9 /100 | #74 | Exceptional 28.5% |
| Immigrants | Jordan | 99.9 /100 | #75 | Exceptional 28.4% |
| Immigrants | Sri Lanka | 99.9 /100 | #76 | Exceptional 28.4% |
| Nigerians | 99.8 /100 | #77 | Exceptional 28.4% |
| Immigrants | Nepal | 99.8 /100 | #78 | Exceptional 28.4% |
| Immigrants | Iraq | 99.8 /100 | #79 | Exceptional 28.4% |
| Natives/Alaskans | 99.8 /100 | #80 | Exceptional 28.4% |
| South Americans | 99.8 /100 | #81 | Exceptional 28.4% |
| Kenyans | 99.8 /100 | #82 | Exceptional 28.4% |
| Nicaraguans | 99.8 /100 | #83 | Exceptional 28.4% |
| Costa Ricans | 99.8 /100 | #84 | Exceptional 28.4% |
| Immigrants | Syria | 99.8 /100 | #85 | Exceptional 28.4% |
| Immigrants | Western Africa | 99.6 /100 | #86 | Exceptional 28.3% |
| Colombians | 99.6 /100 | #87 | Exceptional 28.3% |
| Liberians | 99.6 /100 | #88 | Exceptional 28.3% |