Slavic vs Canadian Married-couple Households
COMPARE
Slavic
Canadian
Married-couple Households
Married-couple Households Comparison
Slavs
Canadians
47.8%
MARRIED-COUPLE HOUSEHOLDS
96.0/ 100
METRIC RATING
102nd/ 347
METRIC RANK
48.2%
MARRIED-COUPLE HOUSEHOLDS
98.2/ 100
METRIC RATING
77th/ 347
METRIC RANK
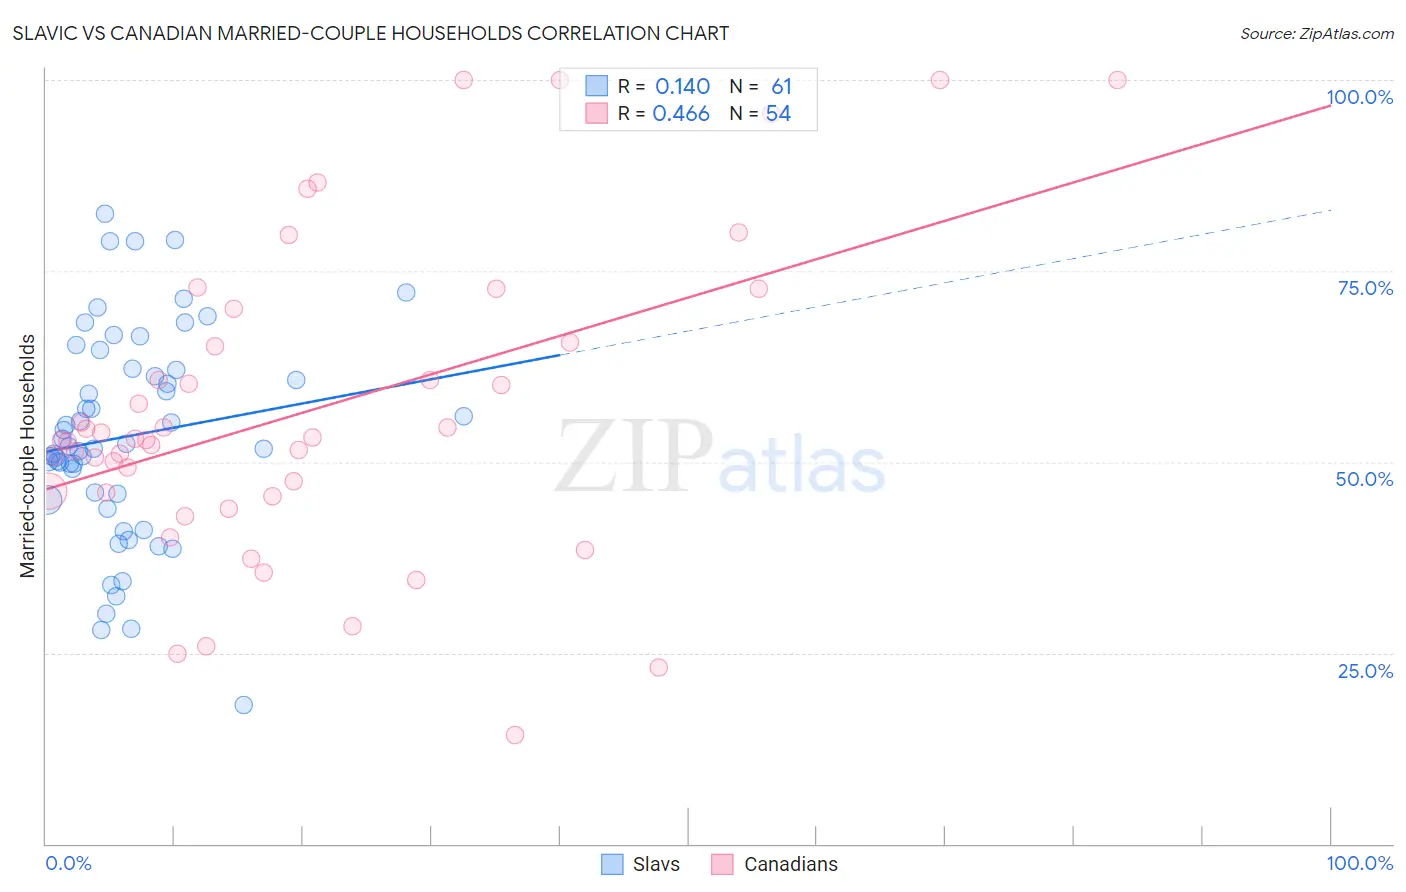
Slavic vs Canadian Married-couple Households Correlation Chart
The statistical analysis conducted on geographies consisting of 270,816,374 people shows a poor positive correlation between the proportion of Slavs and percentage of married-couple family households in the United States with a correlation coefficient (R) of 0.140 and weighted average of 47.8%. Similarly, the statistical analysis conducted on geographies consisting of 437,266,431 people shows a moderate positive correlation between the proportion of Canadians and percentage of married-couple family households in the United States with a correlation coefficient (R) of 0.466 and weighted average of 48.2%, a difference of 0.75%.
Married-couple Households Correlation Summary
| Measurement | Slavic | Canadian |
| Minimum | 18.2% | 14.3% |
| Maximum | 82.5% | 100.0% |
| Range | 64.3% | 85.7% |
| Mean | 53.3% | 56.7% |
| Median | 52.1% | 52.9% |
| Interquartile 25% (IQ1) | 45.5% | 46.0% |
| Interquartile 75% (IQ3) | 62.2% | 65.6% |
| Interquartile Range (IQR) | 16.7% | 19.6% |
| Standard Deviation (Sample) | 13.7% | 20.3% |
| Standard Deviation (Population) | 13.6% | 20.1% |
Similar Demographics by Married-couple Households
Demographics Similar to Slavs by Married-couple Households
In terms of married-couple households, the demographic groups most similar to Slavs are Hawaiian (47.8%, a difference of 0.0%), Immigrants from South Africa (47.8%, a difference of 0.010%), Turkish (47.8%, a difference of 0.020%), Immigrants from Italy (47.9%, a difference of 0.080%), and Immigrants from Austria (47.9%, a difference of 0.090%).
| Demographics | Rating | Rank | Married-couple Households |
| Immigrants | Belgium | 96.8 /100 | #95 | Exceptional 47.9% |
| Immigrants | Egypt | 96.6 /100 | #96 | Exceptional 47.9% |
| Latvians | 96.5 /100 | #97 | Exceptional 47.9% |
| Immigrants | North Macedonia | 96.4 /100 | #98 | Exceptional 47.9% |
| Immigrants | Austria | 96.4 /100 | #99 | Exceptional 47.9% |
| Immigrants | Italy | 96.3 /100 | #100 | Exceptional 47.9% |
| Turks | 96.1 /100 | #101 | Exceptional 47.8% |
| Slavs | 96.0 /100 | #102 | Exceptional 47.8% |
| Hawaiians | 96.0 /100 | #103 | Exceptional 47.8% |
| Immigrants | South Africa | 96.0 /100 | #104 | Exceptional 47.8% |
| Immigrants | Czechoslovakia | 95.5 /100 | #105 | Exceptional 47.8% |
| Portuguese | 95.5 /100 | #106 | Exceptional 47.8% |
| Estonians | 94.7 /100 | #107 | Exceptional 47.7% |
| Immigrants | Japan | 94.4 /100 | #108 | Exceptional 47.7% |
| Immigrants | Jordan | 94.1 /100 | #109 | Exceptional 47.7% |
Demographics Similar to Canadians by Married-couple Households
In terms of married-couple households, the demographic groups most similar to Canadians are Egyptian (48.2%, a difference of 0.020%), Immigrants from Netherlands (48.2%, a difference of 0.030%), Russian (48.2%, a difference of 0.050%), Immigrants from England (48.2%, a difference of 0.10%), and Immigrants from Fiji (48.2%, a difference of 0.10%).
| Demographics | Rating | Rank | Married-couple Households |
| Immigrants | North America | 98.9 /100 | #70 | Exceptional 48.4% |
| Laotians | 98.8 /100 | #71 | Exceptional 48.4% |
| Scotch-Irish | 98.6 /100 | #72 | Exceptional 48.3% |
| Immigrants | Singapore | 98.6 /100 | #73 | Exceptional 48.3% |
| Immigrants | Romania | 98.6 /100 | #74 | Exceptional 48.3% |
| Immigrants | England | 98.4 /100 | #75 | Exceptional 48.2% |
| Immigrants | Fiji | 98.4 /100 | #76 | Exceptional 48.2% |
| Canadians | 98.2 /100 | #77 | Exceptional 48.2% |
| Egyptians | 98.2 /100 | #78 | Exceptional 48.2% |
| Immigrants | Netherlands | 98.2 /100 | #79 | Exceptional 48.2% |
| Russians | 98.1 /100 | #80 | Exceptional 48.2% |
| Finns | 98.0 /100 | #81 | Exceptional 48.1% |
| Immigrants | Poland | 97.7 /100 | #82 | Exceptional 48.1% |
| Guamanians/Chamorros | 97.6 /100 | #83 | Exceptional 48.1% |
| Ukrainians | 97.6 /100 | #84 | Exceptional 48.1% |