Scottish vs Crow Single Mother Households
COMPARE
Scottish
Crow
Single Mother Households
Single Mother Households Comparison
Scottish
Crow
5.8%
SINGLE MOTHER HOUSEHOLDS
96.2/ 100
METRIC RATING
103rd/ 347
METRIC RANK
7.4%
SINGLE MOTHER HOUSEHOLDS
0.1/ 100
METRIC RATING
265th/ 347
METRIC RANK
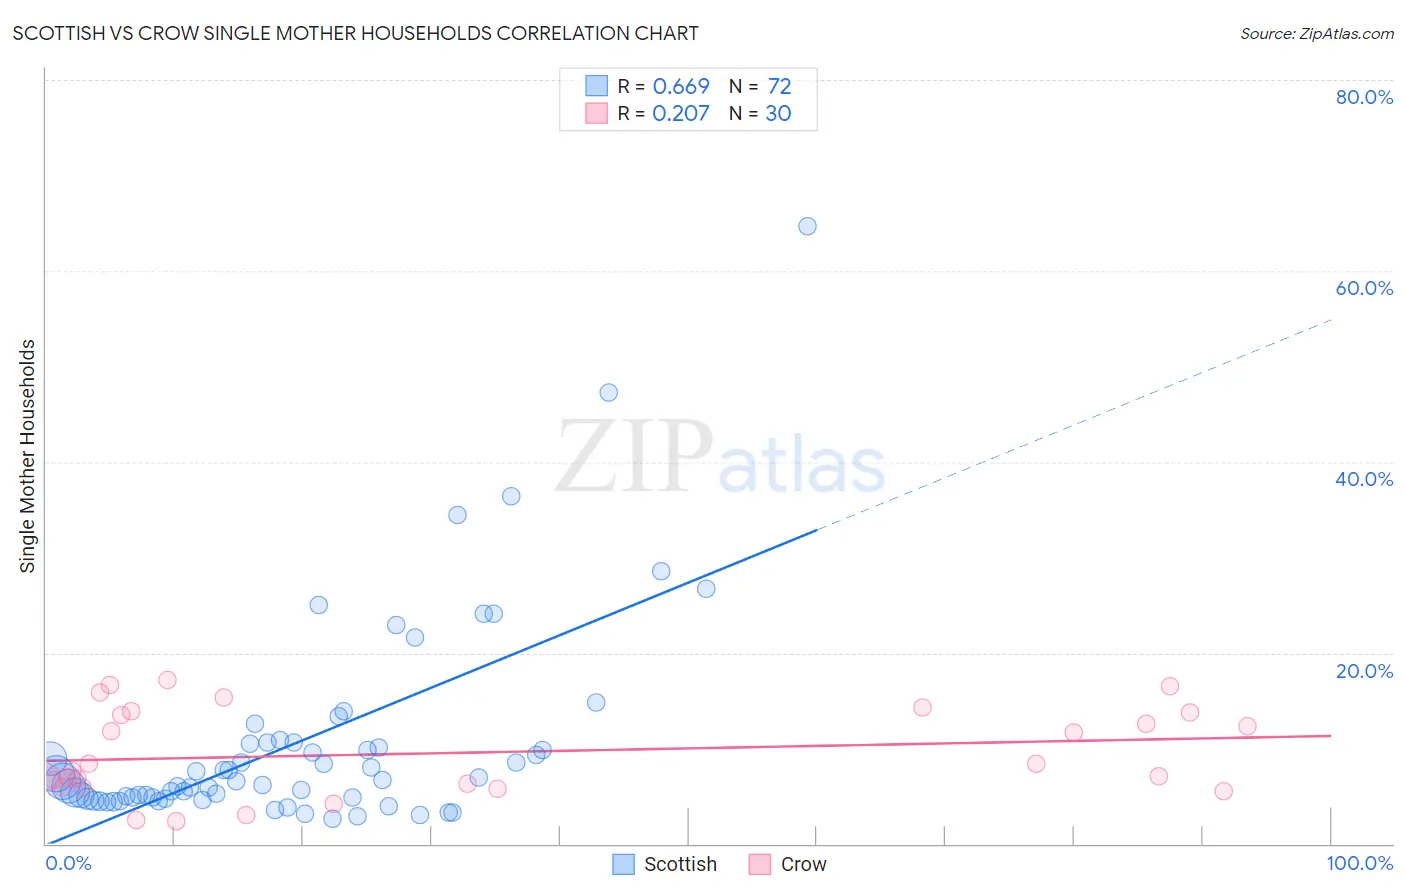
Scottish vs Crow Single Mother Households Correlation Chart
The statistical analysis conducted on geographies consisting of 561,711,947 people shows a significant positive correlation between the proportion of Scottish and percentage of single mother households in the United States with a correlation coefficient (R) of 0.669 and weighted average of 5.8%. Similarly, the statistical analysis conducted on geographies consisting of 59,176,023 people shows a weak positive correlation between the proportion of Crow and percentage of single mother households in the United States with a correlation coefficient (R) of 0.207 and weighted average of 7.4%, a difference of 29.4%.
Single Mother Households Correlation Summary
| Measurement | Scottish | Crow |
| Minimum | 2.6% | 2.4% |
| Maximum | 64.7% | 17.1% |
| Range | 62.1% | 14.8% |
| Mean | 10.6% | 9.5% |
| Median | 6.6% | 8.0% |
| Interquartile 25% (IQ1) | 4.8% | 5.9% |
| Interquartile 75% (IQ3) | 10.5% | 13.8% |
| Interquartile Range (IQR) | 5.7% | 7.8% |
| Standard Deviation (Sample) | 10.9% | 4.6% |
| Standard Deviation (Population) | 10.8% | 4.5% |
Similar Demographics by Single Mother Households
Demographics Similar to Scottish by Single Mother Households
In terms of single mother households, the demographic groups most similar to Scottish are Northern European (5.8%, a difference of 0.010%), German (5.8%, a difference of 0.020%), English (5.8%, a difference of 0.020%), Scandinavian (5.8%, a difference of 0.050%), and Immigrants from Poland (5.8%, a difference of 0.070%).
| Demographics | Rating | Rank | Single Mother Households |
| Austrians | 96.4 /100 | #96 | Exceptional 5.7% |
| Tlingit-Haida | 96.4 /100 | #97 | Exceptional 5.7% |
| Immigrants | South Africa | 96.3 /100 | #98 | Exceptional 5.7% |
| Immigrants | Poland | 96.3 /100 | #99 | Exceptional 5.8% |
| Scandinavians | 96.2 /100 | #100 | Exceptional 5.8% |
| Germans | 96.2 /100 | #101 | Exceptional 5.8% |
| English | 96.2 /100 | #102 | Exceptional 5.8% |
| Scottish | 96.2 /100 | #103 | Exceptional 5.8% |
| Northern Europeans | 96.2 /100 | #104 | Exceptional 5.8% |
| Taiwanese | 96.1 /100 | #105 | Exceptional 5.8% |
| Immigrants | Ukraine | 95.9 /100 | #106 | Exceptional 5.8% |
| Paraguayans | 95.8 /100 | #107 | Exceptional 5.8% |
| Immigrants | Italy | 95.8 /100 | #108 | Exceptional 5.8% |
| Immigrants | Western Europe | 95.7 /100 | #109 | Exceptional 5.8% |
| British | 95.5 /100 | #110 | Exceptional 5.8% |
Demographics Similar to Crow by Single Mother Households
In terms of single mother households, the demographic groups most similar to Crow are Nepalese (7.5%, a difference of 0.090%), Yaqui (7.4%, a difference of 0.18%), Immigrants from Nicaragua (7.4%, a difference of 0.25%), Immigrants from Somalia (7.4%, a difference of 0.40%), and Blackfeet (7.5%, a difference of 0.43%).
| Demographics | Rating | Rank | Single Mother Households |
| Pueblo | 0.2 /100 | #258 | Tragic 7.4% |
| Immigrants | Yemen | 0.2 /100 | #259 | Tragic 7.4% |
| Immigrants | Zaire | 0.2 /100 | #260 | Tragic 7.4% |
| Japanese | 0.2 /100 | #261 | Tragic 7.4% |
| Immigrants | Somalia | 0.2 /100 | #262 | Tragic 7.4% |
| Immigrants | Nicaragua | 0.2 /100 | #263 | Tragic 7.4% |
| Yaqui | 0.1 /100 | #264 | Tragic 7.4% |
| Crow | 0.1 /100 | #265 | Tragic 7.4% |
| Nepalese | 0.1 /100 | #266 | Tragic 7.5% |
| Blackfeet | 0.1 /100 | #267 | Tragic 7.5% |
| Indonesians | 0.1 /100 | #268 | Tragic 7.5% |
| Somalis | 0.1 /100 | #269 | Tragic 7.5% |
| Immigrants | Cuba | 0.1 /100 | #270 | Tragic 7.5% |
| Salvadorans | 0.1 /100 | #271 | Tragic 7.5% |
| Immigrants | Azores | 0.1 /100 | #272 | Tragic 7.5% |