Scandinavian vs New Zealander Births to Unmarried Women
COMPARE
Scandinavian
New Zealander
Births to Unmarried Women
Births to Unmarried Women Comparison
Scandinavians
New Zealanders
29.8%
BIRTHS TO UNMARRIED WOMEN
92.7/ 100
METRIC RATING
113th/ 347
METRIC RANK
30.3%
BIRTHS TO UNMARRIED WOMEN
85.5/ 100
METRIC RATING
132nd/ 347
METRIC RANK
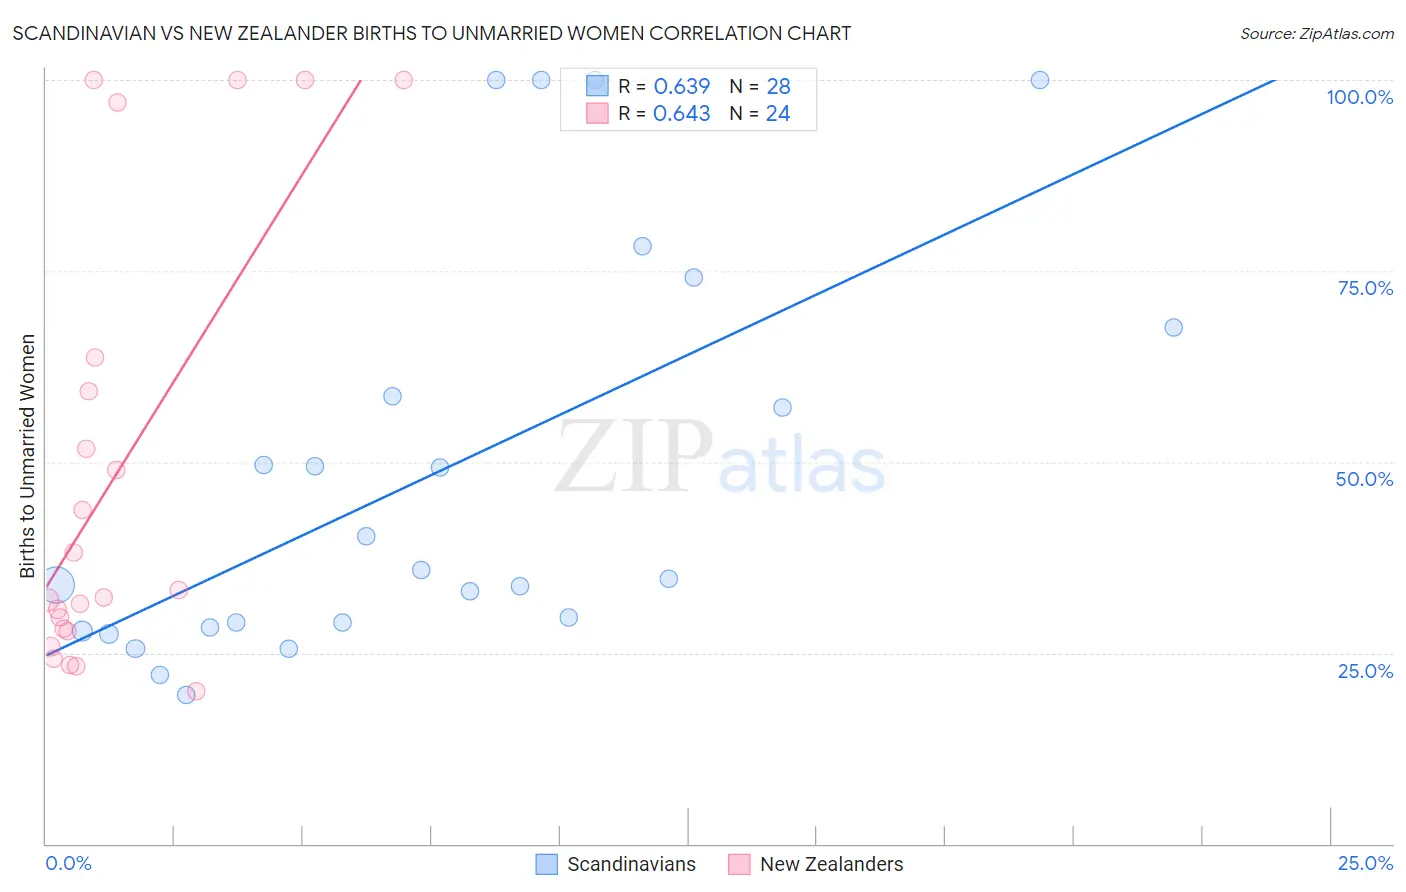
Scandinavian vs New Zealander Births to Unmarried Women Correlation Chart
The statistical analysis conducted on geographies consisting of 430,139,153 people shows a significant positive correlation between the proportion of Scandinavians and percentage of births to unmarried women in the United States with a correlation coefficient (R) of 0.639 and weighted average of 29.8%. Similarly, the statistical analysis conducted on geographies consisting of 103,815,095 people shows a significant positive correlation between the proportion of New Zealanders and percentage of births to unmarried women in the United States with a correlation coefficient (R) of 0.643 and weighted average of 30.3%, a difference of 1.9%.
Births to Unmarried Women Correlation Summary
| Measurement | Scandinavian | New Zealander |
| Minimum | 19.6% | 20.0% |
| Maximum | 100.0% | 100.0% |
| Range | 80.4% | 80.0% |
| Mean | 48.5% | 48.5% |
| Median | 35.3% | 32.8% |
| Interquartile 25% (IQ1) | 28.6% | 28.0% |
| Interquartile 75% (IQ3) | 63.0% | 61.5% |
| Interquartile Range (IQR) | 34.4% | 33.5% |
| Standard Deviation (Sample) | 26.4% | 28.9% |
| Standard Deviation (Population) | 25.9% | 28.3% |
Demographics Similar to Scandinavians and New Zealanders by Births to Unmarried Women
In terms of births to unmarried women, the demographic groups most similar to Scandinavians are Immigrants from Croatia (29.8%, a difference of 0.060%), Basque (29.7%, a difference of 0.10%), Ethiopian (29.8%, a difference of 0.28%), Immigrants from Italy (29.9%, a difference of 0.36%), and Immigrants from Netherlands (29.9%, a difference of 0.57%). Similarly, the demographic groups most similar to New Zealanders are Immigrants from Zimbabwe (30.3%, a difference of 0.030%), Immigrants from Bosnia and Herzegovina (30.3%, a difference of 0.050%), Immigrants from Spain (30.3%, a difference of 0.060%), Icelander (30.3%, a difference of 0.10%), and Chinese (30.2%, a difference of 0.34%).
| Demographics | Rating | Rank | Births to Unmarried Women |
| Basques | 93.0 /100 | #112 | Exceptional 29.7% |
| Scandinavians | 92.7 /100 | #113 | Exceptional 29.8% |
| Immigrants | Croatia | 92.6 /100 | #114 | Exceptional 29.8% |
| Ethiopians | 91.9 /100 | #115 | Exceptional 29.8% |
| Immigrants | Italy | 91.7 /100 | #116 | Exceptional 29.9% |
| Immigrants | Netherlands | 91.1 /100 | #117 | Exceptional 29.9% |
| Immigrants | Norway | 91.0 /100 | #118 | Exceptional 29.9% |
| Argentineans | 90.5 /100 | #119 | Exceptional 30.0% |
| Ugandans | 89.2 /100 | #120 | Excellent 30.1% |
| Koreans | 88.9 /100 | #121 | Excellent 30.1% |
| Immigrants | Argentina | 88.7 /100 | #122 | Excellent 30.1% |
| Syrians | 88.2 /100 | #123 | Excellent 30.2% |
| Croatians | 88.0 /100 | #124 | Excellent 30.2% |
| Vietnamese | 87.7 /100 | #125 | Excellent 30.2% |
| Europeans | 87.2 /100 | #126 | Excellent 30.2% |
| Chinese | 87.1 /100 | #127 | Excellent 30.2% |
| Icelanders | 86.0 /100 | #128 | Excellent 30.3% |
| Immigrants | Spain | 85.8 /100 | #129 | Excellent 30.3% |
| Immigrants | Bosnia and Herzegovina | 85.7 /100 | #130 | Excellent 30.3% |
| Immigrants | Zimbabwe | 85.7 /100 | #131 | Excellent 30.3% |
| New Zealanders | 85.5 /100 | #132 | Excellent 30.3% |