Russian vs Iraqi Family Households with Children
COMPARE
Russian
Iraqi
Family Households with Children
Family Households with Children Comparison
Russians
Iraqis
26.5%
FAMILY HOUSEHOLDS WITH CHILDREN
0.2/ 100
METRIC RATING
288th/ 347
METRIC RANK
28.5%
FAMILY HOUSEHOLDS WITH CHILDREN
99.9/ 100
METRIC RATING
73rd/ 347
METRIC RANK
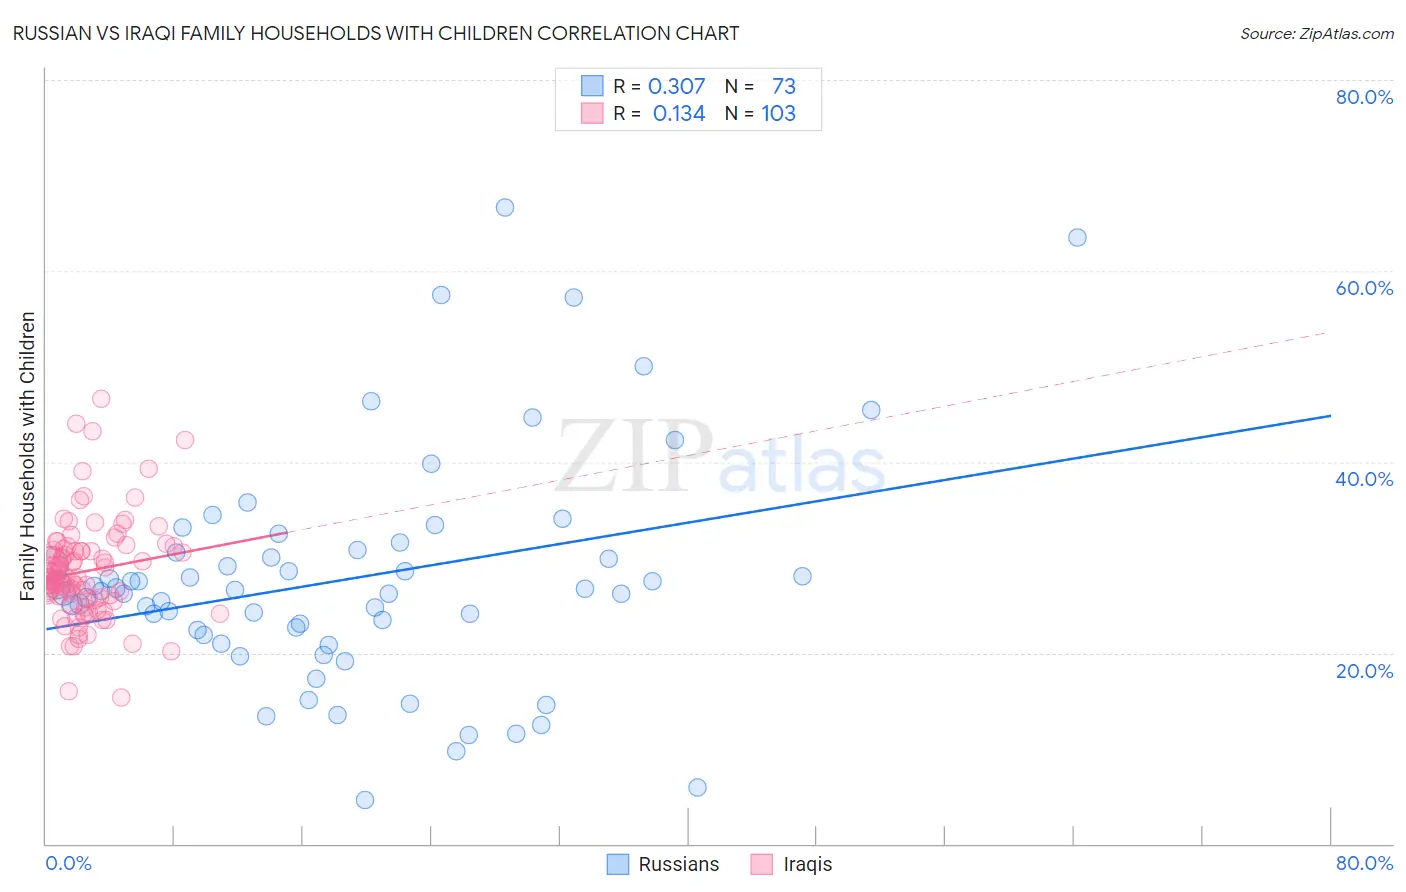
Russian vs Iraqi Family Households with Children Correlation Chart
The statistical analysis conducted on geographies consisting of 511,427,529 people shows a mild positive correlation between the proportion of Russians and percentage of family households with children in the United States with a correlation coefficient (R) of 0.307 and weighted average of 26.5%. Similarly, the statistical analysis conducted on geographies consisting of 170,533,912 people shows a poor positive correlation between the proportion of Iraqis and percentage of family households with children in the United States with a correlation coefficient (R) of 0.134 and weighted average of 28.5%, a difference of 7.4%.
Family Households with Children Correlation Summary
| Measurement | Russian | Iraqi |
| Minimum | 4.6% | 15.3% |
| Maximum | 66.7% | 46.5% |
| Range | 62.1% | 31.3% |
| Mean | 27.7% | 28.5% |
| Median | 26.5% | 27.9% |
| Interquartile 25% (IQ1) | 22.2% | 25.6% |
| Interquartile 75% (IQ3) | 30.6% | 30.8% |
| Interquartile Range (IQR) | 8.5% | 5.2% |
| Standard Deviation (Sample) | 12.0% | 5.2% |
| Standard Deviation (Population) | 11.9% | 5.2% |
Similar Demographics by Family Households with Children
Demographics Similar to Russians by Family Households with Children
In terms of family households with children, the demographic groups most similar to Russians are Immigrants from Senegal (26.5%, a difference of 0.020%), Shoshone (26.5%, a difference of 0.020%), Immigrants from Sweden (26.5%, a difference of 0.050%), Cambodian (26.5%, a difference of 0.070%), and Immigrants from Canada (26.5%, a difference of 0.10%).
| Demographics | Rating | Rank | Family Households with Children |
| Lithuanians | 0.3 /100 | #281 | Tragic 26.6% |
| French American Indians | 0.3 /100 | #282 | Tragic 26.6% |
| Immigrants | North America | 0.3 /100 | #283 | Tragic 26.6% |
| Immigrants | Canada | 0.3 /100 | #284 | Tragic 26.5% |
| Cambodians | 0.2 /100 | #285 | Tragic 26.5% |
| Immigrants | Senegal | 0.2 /100 | #286 | Tragic 26.5% |
| Shoshone | 0.2 /100 | #287 | Tragic 26.5% |
| Russians | 0.2 /100 | #288 | Tragic 26.5% |
| Immigrants | Sweden | 0.2 /100 | #289 | Tragic 26.5% |
| Albanians | 0.2 /100 | #290 | Tragic 26.5% |
| Bahamians | 0.2 /100 | #291 | Tragic 26.5% |
| Poles | 0.2 /100 | #292 | Tragic 26.5% |
| Blacks/African Americans | 0.1 /100 | #293 | Tragic 26.5% |
| Latvians | 0.1 /100 | #294 | Tragic 26.4% |
| Macedonians | 0.1 /100 | #295 | Tragic 26.4% |
Demographics Similar to Iraqis by Family Households with Children
In terms of family households with children, the demographic groups most similar to Iraqis are Laotian (28.5%, a difference of 0.010%), Immigrants from Indonesia (28.5%, a difference of 0.030%), Burmese (28.5%, a difference of 0.040%), Immigrants from Honduras (28.5%, a difference of 0.050%), and Immigrants from Korea (28.5%, a difference of 0.11%).
| Demographics | Rating | Rank | Family Households with Children |
| Immigrants | Egypt | 99.9 /100 | #66 | Exceptional 28.5% |
| Ghanaians | 99.9 /100 | #67 | Exceptional 28.5% |
| Houma | 99.9 /100 | #68 | Exceptional 28.5% |
| Immigrants | Korea | 99.9 /100 | #69 | Exceptional 28.5% |
| Immigrants | Honduras | 99.9 /100 | #70 | Exceptional 28.5% |
| Burmese | 99.9 /100 | #71 | Exceptional 28.5% |
| Immigrants | Indonesia | 99.9 /100 | #72 | Exceptional 28.5% |
| Iraqis | 99.9 /100 | #73 | Exceptional 28.5% |
| Laotians | 99.9 /100 | #74 | Exceptional 28.5% |
| Immigrants | Jordan | 99.9 /100 | #75 | Exceptional 28.4% |
| Immigrants | Sri Lanka | 99.9 /100 | #76 | Exceptional 28.4% |
| Nigerians | 99.8 /100 | #77 | Exceptional 28.4% |
| Immigrants | Nepal | 99.8 /100 | #78 | Exceptional 28.4% |
| Immigrants | Iraq | 99.8 /100 | #79 | Exceptional 28.4% |
| Natives/Alaskans | 99.8 /100 | #80 | Exceptional 28.4% |