Puget Sound Salish vs Nepalese Births to Unmarried Women
COMPARE
Puget Sound Salish
Nepalese
Births to Unmarried Women
Births to Unmarried Women Comparison
Puget Sound Salish
Nepalese
30.4%
BIRTHS TO UNMARRIED WOMEN
83.9/ 100
METRIC RATING
138th/ 347
METRIC RANK
33.5%
BIRTHS TO UNMARRIED WOMEN
7.8/ 100
METRIC RATING
216th/ 347
METRIC RANK
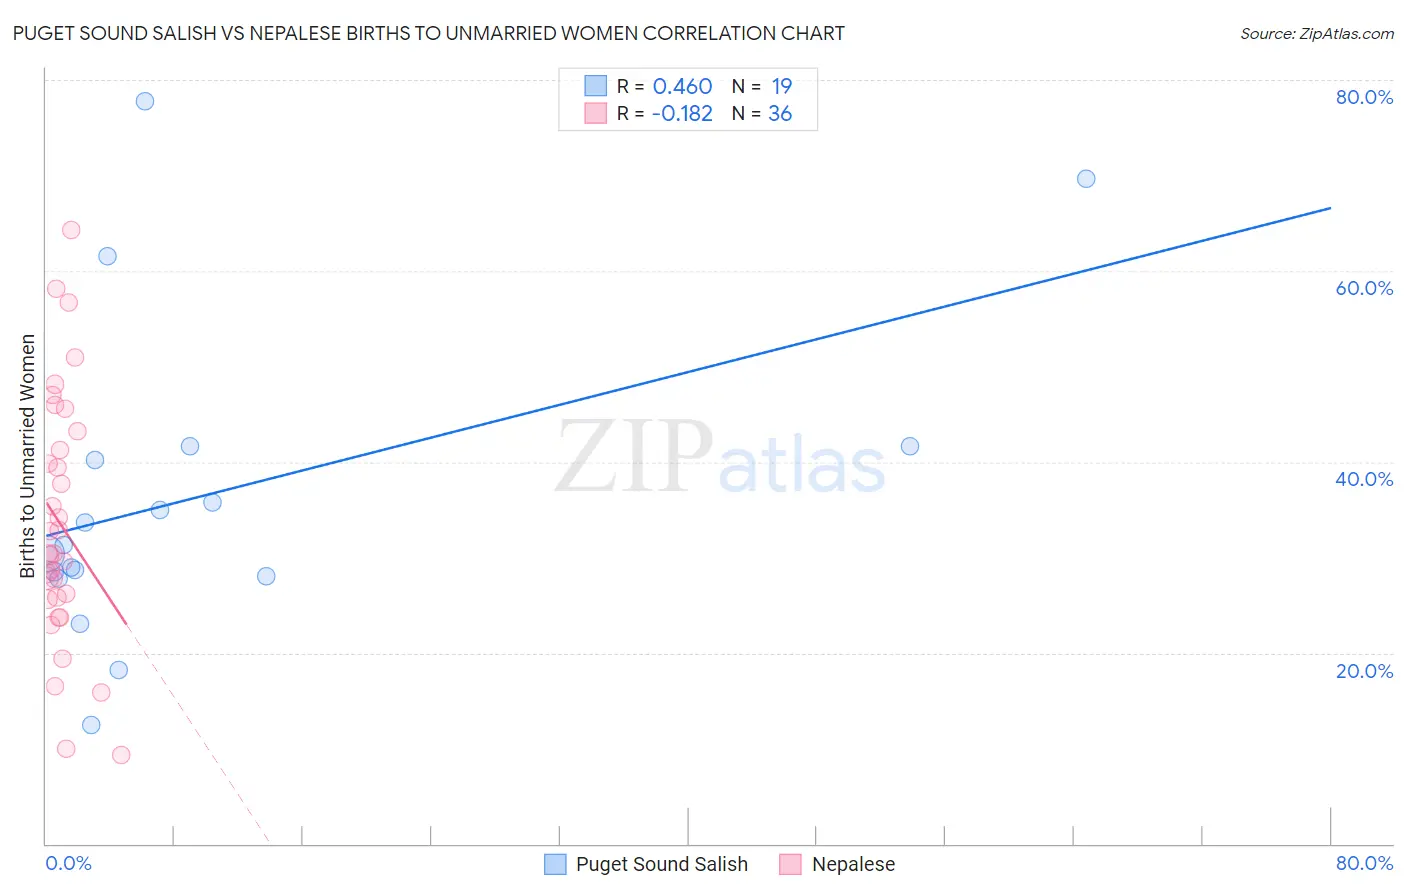
Puget Sound Salish vs Nepalese Births to Unmarried Women Correlation Chart
The statistical analysis conducted on geographies consisting of 44,862,304 people shows a moderate positive correlation between the proportion of Puget Sound Salish and percentage of births to unmarried women in the United States with a correlation coefficient (R) of 0.460 and weighted average of 30.4%. Similarly, the statistical analysis conducted on geographies consisting of 24,298,427 people shows a poor negative correlation between the proportion of Nepalese and percentage of births to unmarried women in the United States with a correlation coefficient (R) of -0.182 and weighted average of 33.5%, a difference of 10.2%.
Births to Unmarried Women Correlation Summary
| Measurement | Puget Sound Salish | Nepalese |
| Minimum | 12.4% | 9.3% |
| Maximum | 77.8% | 64.3% |
| Range | 65.4% | 55.0% |
| Mean | 36.5% | 33.5% |
| Median | 31.3% | 30.4% |
| Interquartile 25% (IQ1) | 28.0% | 25.7% |
| Interquartile 75% (IQ3) | 41.7% | 42.2% |
| Interquartile Range (IQR) | 13.7% | 16.5% |
| Standard Deviation (Sample) | 16.7% | 13.0% |
| Standard Deviation (Population) | 16.2% | 12.8% |
Similar Demographics by Births to Unmarried Women
Demographics Similar to Puget Sound Salish by Births to Unmarried Women
In terms of births to unmarried women, the demographic groups most similar to Puget Sound Salish are Immigrants from Philippines (30.4%, a difference of 0.0%), Immigrants from Canada (30.4%, a difference of 0.030%), Immigrants from Scotland (30.4%, a difference of 0.13%), Swiss (30.5%, a difference of 0.14%), and Pakistani (30.5%, a difference of 0.16%).
| Demographics | Rating | Rank | Births to Unmarried Women |
| Immigrants | Zimbabwe | 85.7 /100 | #131 | Excellent 30.3% |
| New Zealanders | 85.5 /100 | #132 | Excellent 30.3% |
| Immigrants | Morocco | 85.2 /100 | #133 | Excellent 30.4% |
| Immigrants | South Eastern Asia | 85.2 /100 | #134 | Excellent 30.4% |
| Brazilians | 84.8 /100 | #135 | Excellent 30.4% |
| Immigrants | Scotland | 84.6 /100 | #136 | Excellent 30.4% |
| Immigrants | Philippines | 83.9 /100 | #137 | Excellent 30.4% |
| Puget Sound Salish | 83.9 /100 | #138 | Excellent 30.4% |
| Immigrants | Canada | 83.7 /100 | #139 | Excellent 30.4% |
| Swiss | 83.1 /100 | #140 | Excellent 30.5% |
| Pakistanis | 83.0 /100 | #141 | Excellent 30.5% |
| South Africans | 82.7 /100 | #142 | Excellent 30.5% |
| Immigrants | Uganda | 82.6 /100 | #143 | Excellent 30.5% |
| Czechs | 82.1 /100 | #144 | Excellent 30.5% |
| Immigrants | North America | 81.5 /100 | #145 | Excellent 30.6% |
Demographics Similar to Nepalese by Births to Unmarried Women
In terms of births to unmarried women, the demographic groups most similar to Nepalese are Spaniard (33.6%, a difference of 0.24%), French (33.4%, a difference of 0.27%), Slovak (33.4%, a difference of 0.45%), Immigrants from Costa Rica (33.4%, a difference of 0.49%), and Immigrants from Ecuador (33.7%, a difference of 0.64%).
| Demographics | Rating | Rank | Births to Unmarried Women |
| Whites/Caucasians | 10.7 /100 | #209 | Poor 33.3% |
| Scotch-Irish | 10.7 /100 | #210 | Poor 33.3% |
| Ecuadorians | 10.5 /100 | #211 | Poor 33.3% |
| Celtics | 10.2 /100 | #212 | Poor 33.3% |
| Immigrants | Costa Rica | 9.5 /100 | #213 | Tragic 33.4% |
| Slovaks | 9.3 /100 | #214 | Tragic 33.4% |
| French | 8.7 /100 | #215 | Tragic 33.4% |
| Nepalese | 7.8 /100 | #216 | Tragic 33.5% |
| Spaniards | 7.0 /100 | #217 | Tragic 33.6% |
| Immigrants | Ecuador | 5.9 /100 | #218 | Tragic 33.7% |
| Alsatians | 5.4 /100 | #219 | Tragic 33.8% |
| Portuguese | 5.4 /100 | #220 | Tragic 33.8% |
| Malaysians | 5.0 /100 | #221 | Tragic 33.9% |
| Immigrants | Uruguay | 4.8 /100 | #222 | Tragic 33.9% |
| Pennsylvania Germans | 4.3 /100 | #223 | Tragic 34.0% |