Peruvian vs Immigrants from Bangladesh Single Father Households
COMPARE
Peruvian
Immigrants from Bangladesh
Single Father Households
Single Father Households Comparison
Peruvians
Immigrants from Bangladesh
2.4%
SINGLE FATHER HOUSEHOLDS
27.1/ 100
METRIC RATING
200th/ 347
METRIC RANK
2.1%
SINGLE FATHER HOUSEHOLDS
99.8/ 100
METRIC RATING
73rd/ 347
METRIC RANK
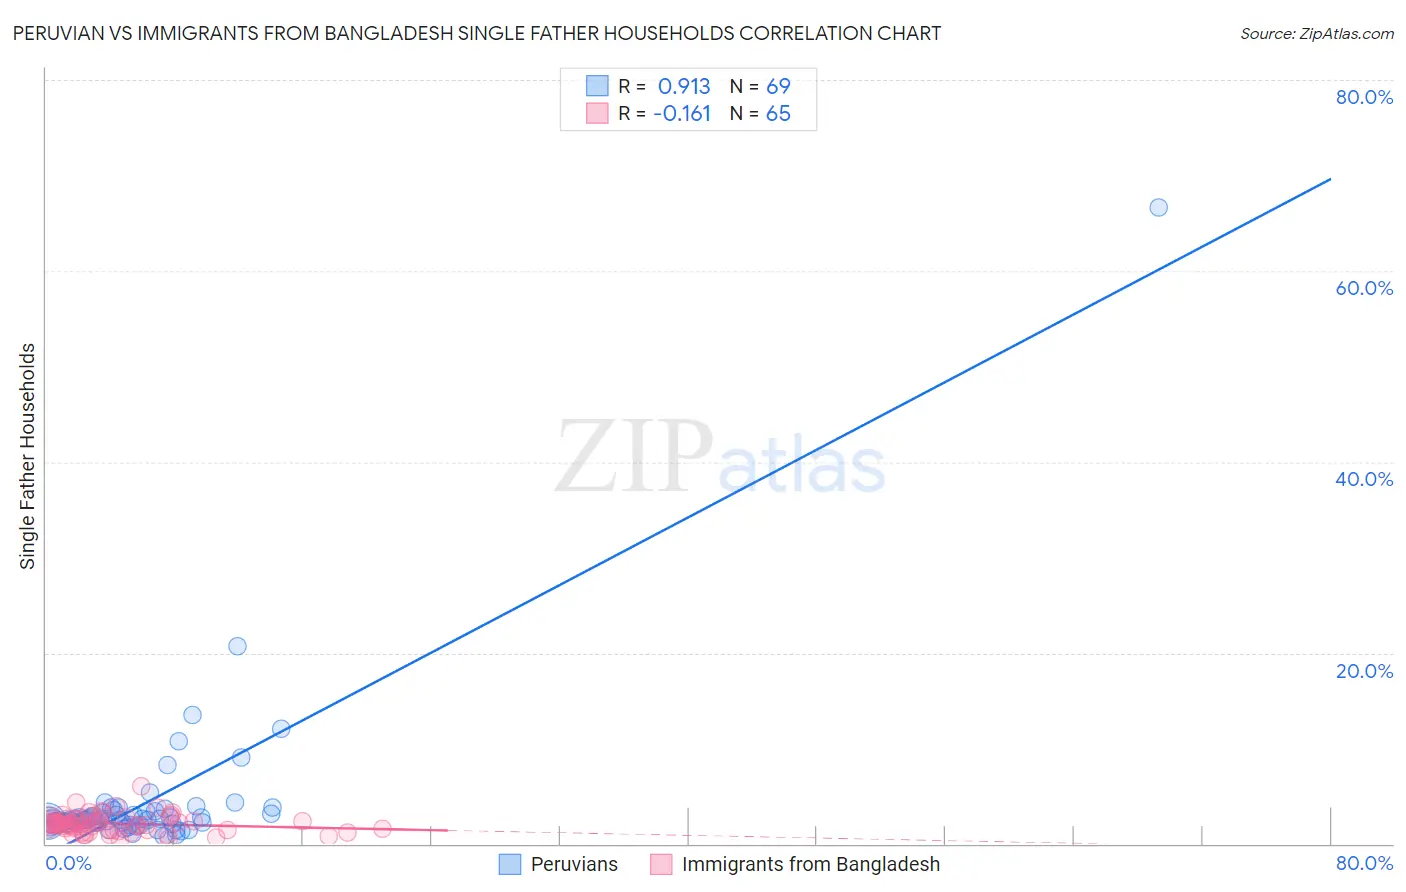
Peruvian vs Immigrants from Bangladesh Single Father Households Correlation Chart
The statistical analysis conducted on geographies consisting of 360,687,122 people shows a near-perfect positive correlation between the proportion of Peruvians and percentage of single father households in the United States with a correlation coefficient (R) of 0.913 and weighted average of 2.4%. Similarly, the statistical analysis conducted on geographies consisting of 202,870,334 people shows a poor negative correlation between the proportion of Immigrants from Bangladesh and percentage of single father households in the United States with a correlation coefficient (R) of -0.161 and weighted average of 2.1%, a difference of 15.0%.
Single Father Households Correlation Summary
| Measurement | Peruvian | Immigrants from Bangladesh |
| Minimum | 0.80% | 0.44% |
| Maximum | 66.7% | 6.0% |
| Range | 65.9% | 5.5% |
| Mean | 4.3% | 2.1% |
| Median | 2.5% | 2.1% |
| Interquartile 25% (IQ1) | 2.2% | 1.4% |
| Interquartile 75% (IQ3) | 3.4% | 2.5% |
| Interquartile Range (IQR) | 1.2% | 1.1% |
| Standard Deviation (Sample) | 8.2% | 0.96% |
| Standard Deviation (Population) | 8.2% | 0.96% |
Similar Demographics by Single Father Households
Demographics Similar to Peruvians by Single Father Households
In terms of single father households, the demographic groups most similar to Peruvians are Immigrants from Vietnam (2.4%, a difference of 0.0%), Scandinavian (2.4%, a difference of 0.030%), German (2.4%, a difference of 0.080%), Kenyan (2.4%, a difference of 0.090%), and Immigrants from Uganda (2.4%, a difference of 0.10%).
| Demographics | Rating | Rank | Single Father Households |
| Uruguayans | 29.7 /100 | #193 | Fair 2.4% |
| Panamanians | 29.6 /100 | #194 | Fair 2.4% |
| Immigrants | Philippines | 28.7 /100 | #195 | Fair 2.4% |
| Kenyans | 28.0 /100 | #196 | Fair 2.4% |
| Germans | 28.0 /100 | #197 | Fair 2.4% |
| Scandinavians | 27.4 /100 | #198 | Fair 2.4% |
| Immigrants | Vietnam | 27.1 /100 | #199 | Fair 2.4% |
| Peruvians | 27.1 /100 | #200 | Fair 2.4% |
| Immigrants | Uganda | 26.0 /100 | #201 | Fair 2.4% |
| German Russians | 25.7 /100 | #202 | Fair 2.4% |
| French Canadians | 24.7 /100 | #203 | Fair 2.4% |
| Ecuadorians | 24.5 /100 | #204 | Fair 2.4% |
| Immigrants | Afghanistan | 24.2 /100 | #205 | Fair 2.4% |
| Koreans | 24.1 /100 | #206 | Fair 2.4% |
| Whites/Caucasians | 22.6 /100 | #207 | Fair 2.4% |
Demographics Similar to Immigrants from Bangladesh by Single Father Households
In terms of single father households, the demographic groups most similar to Immigrants from Bangladesh are Immigrants from Egypt (2.1%, a difference of 0.0%), Immigrants from Spain (2.1%, a difference of 0.14%), Immigrants from Kuwait (2.1%, a difference of 0.15%), Egyptian (2.1%, a difference of 0.16%), and Immigrants from Sweden (2.1%, a difference of 0.29%).
| Demographics | Rating | Rank | Single Father Households |
| Immigrants | Western Asia | 99.8 /100 | #66 | Exceptional 2.1% |
| Immigrants | Italy | 99.8 /100 | #67 | Exceptional 2.1% |
| Immigrants | Denmark | 99.8 /100 | #68 | Exceptional 2.1% |
| Immigrants | Romania | 99.8 /100 | #69 | Exceptional 2.1% |
| Egyptians | 99.8 /100 | #70 | Exceptional 2.1% |
| Immigrants | Kuwait | 99.8 /100 | #71 | Exceptional 2.1% |
| Immigrants | Spain | 99.8 /100 | #72 | Exceptional 2.1% |
| Immigrants | Bangladesh | 99.8 /100 | #73 | Exceptional 2.1% |
| Immigrants | Egypt | 99.8 /100 | #74 | Exceptional 2.1% |
| Immigrants | Sweden | 99.8 /100 | #75 | Exceptional 2.1% |
| Immigrants | Scotland | 99.8 /100 | #76 | Exceptional 2.1% |
| Immigrants | Saudi Arabia | 99.8 /100 | #77 | Exceptional 2.1% |
| Estonians | 99.7 /100 | #78 | Exceptional 2.1% |
| Immigrants | Asia | 99.7 /100 | #79 | Exceptional 2.1% |
| Immigrants | South Africa | 99.7 /100 | #80 | Exceptional 2.1% |