Pennsylvania German vs Nonimmigrants Divorced or Separated

COMPARE

Pennsylvania German
Race
Ancestry
AfghanAfricanAlaska NativeAlaskan AthabascanAlbanianAleutAlsatianAmericanApacheArabArapahoArgentineanArmenianAssyrian/Chaldean/SyriacAustralianAustrianBahamianBangladeshiBarbadianBasqueBelgianBelizeanBermudanBhutaneseBlackfeetBolivianBrazilianBritishBritish West IndianBulgarianBurmeseCajunCambodianCanadianCape VerdeanCarpatho RusynCelticCentral AmericanCentral American IndianCherokeeCheyenneChickasawChileanChineseChippewaChoctawColombianColvilleComancheCosta RicanCreeCreekCroatianCrowCubanCypriotCzechCzechoslovakianDanishDelawareDominicanDutchDutch West IndianEastern EuropeanEcuadorianEgyptianEnglishEstonianEthiopianEuropeanFijianFilipinoFinnishFrenchFrench American IndianFrench CanadianGermanGerman RussianGhanaianGreekGuamanian/ChamorroGuatemalanGuyaneseHaitianHmongHonduranHopiHoumaHungarianIcelanderIndian (Asian)IndonesianInupiatIranianIraqiIrishIroquoisIsraeliItalianJamaicanJapaneseJordanianKenyanKiowaKoreanLaotianLatvianLebaneseLiberianLithuanianLumbeeLuxembourgerMacedonianMalaysianMalteseMarshalleseMenomineeMexicanMexican American IndianMongolianMoroccanNative HawaiianNavajoNepaleseNew ZealanderNicaraguanNigerianNorthern EuropeanNorwegianOkinawanOsageOttawaPaiutePakistaniPalestinianPanamanianParaguayanPennsylvania GermanPeruvianPimaPolishPortuguesePotawatomiPuebloPuerto RicanPuget Sound SalishRomanianRussianSalvadoranSamoanScandinavianScotch-IrishScottishSeminoleSenegaleseSerbianShoshoneSierra LeoneanSiouxSlavicSlovakSloveneSomaliSouth AfricanSouth AmericanSouth American IndianSoviet UnionSpaniardSpanishSpanish AmericanSpanish American IndianSri LankanSubsaharan AfricanSudaneseSwedishSwissSyrianTaiwaneseThaiTlingit-HaidaTohono O'OdhamTonganTrinidadian and TobagonianTsimshianTurkishU.S. Virgin IslanderUgandanUkrainianUruguayanUteVenezuelanVietnameseWelshWest IndianYakamaYaquiYugoslavianYumanYup'ikZimbabwean
Immigration
ImmigrantsAfghanistanAfricaAlbaniaArgentinaArmeniaAsiaAustraliaAustriaBahamasBangladeshBarbadosBelarusBelgiumBelizeBoliviaBosnia and HerzegovinaBrazilBulgariaBurma/MyanmarCabo VerdeCambodiaCameroonCanadaCaribbeanCentral AmericaChileChinaColombiaCongoCosta RicaCroatiaCubaCzechoslovakiaDenmarkDominicaDominican RepublicEastern AfricaEastern AsiaEastern EuropeEcuadorEgyptEl SalvadorEnglandEritreaEthiopiaEuropeFijiFranceGermanyGhanaGreeceGrenadaGuatemalaGuyanaHaitiHondurasHong KongHungaryIndiaIndonesiaIranIraqIrelandIsraelItalyJamaicaJapanJordanKazakhstanKenyaKoreaKuwaitLaosLatin AmericaLatviaLebanonLiberiaLithuaniaMalaysiaMexicoMicronesiaMiddle AfricaMoldovaMoroccoNepalNetherlandsNicaraguaNigeriaNorth AmericaNorth MacedoniaNorthern AfricaNorthern EuropeNorwayOceaniaPakistanPanamaPeruPhilippinesPolandPortugalRomaniaRussiaSaudi ArabiaScotlandSenegalSerbiaSierra LeoneSingaporeSomaliaSouth AfricaSouth AmericaSouth Central AsiaSouth Eastern AsiaSouthern EuropeSpainSri LankaSt. Vincent and the GrenadinesSudanSwedenSwitzerlandSyriaTaiwanThailandTrinidad and TobagoTurkeyUgandaUkraineUruguayUzbekistanVenezuelaVietnamWest IndiesWestern AfricaWestern AsiaWestern EuropeYemenZaireZimbabweAzores
Nonimmigrants
Race
Ancestry
AfghanAfricanAlaska NativeAlaskan AthabascanAlbanianAleutAlsatianAmericanApacheArabArapahoArgentineanArmenianAssyrian/Chaldean/SyriacAustralianAustrianBahamianBangladeshiBarbadianBasqueBelgianBelizeanBermudanBhutaneseBlackfeetBolivianBrazilianBritishBritish West IndianBulgarianBurmeseCajunCambodianCanadianCape VerdeanCarpatho RusynCelticCentral AmericanCentral American IndianCherokeeCheyenneChickasawChileanChineseChippewaChoctawColombianColvilleComancheCosta RicanCreeCreekCroatianCrowCubanCypriotCzechCzechoslovakianDanishDelawareDominicanDutchDutch West IndianEastern EuropeanEcuadorianEgyptianEnglishEstonianEthiopianEuropeanFijianFilipinoFinnishFrenchFrench American IndianFrench CanadianGermanGerman RussianGhanaianGreekGuamanian/ChamorroGuatemalanGuyaneseHaitianHmongHonduranHopiHoumaHungarianIcelanderIndian (Asian)IndonesianInupiatIranianIraqiIrishIroquoisIsraeliItalianJamaicanJapaneseJordanianKenyanKiowaKoreanLaotianLatvianLebaneseLiberianLithuanianLumbeeLuxembourgerMacedonianMalaysianMalteseMarshalleseMenomineeMexicanMexican American IndianMongolianMoroccanNative HawaiianNavajoNepaleseNew ZealanderNicaraguanNigerianNorthern EuropeanNorwegianOkinawanOsageOttawaPaiutePakistaniPalestinianPanamanianParaguayanPeruvianPimaPolishPortuguesePotawatomiPuebloPuerto RicanPuget Sound SalishRomanianRussianSalvadoranSamoanScandinavianScotch-IrishScottishSeminoleSenegaleseSerbianShoshoneSierra LeoneanSiouxSlavicSlovakSloveneSomaliSouth AfricanSouth AmericanSouth American IndianSoviet UnionSpaniardSpanishSpanish AmericanSpanish American IndianSri LankanSubsaharan AfricanSudaneseSwedishSwissSyrianTaiwaneseThaiTlingit-HaidaTohono O'OdhamTonganTrinidadian and TobagonianTsimshianTurkishU.S. Virgin IslanderUgandanUkrainianUruguayanUteVenezuelanVietnameseWelshWest IndianYakamaYaquiYugoslavianYumanYup'ikZimbabwean
Immigration
NonimmigrantsImmigrantsAfghanistanAfricaAlbaniaArgentinaArmeniaAsiaAustraliaAustriaBahamasBangladeshBarbadosBelarusBelgiumBelizeBoliviaBosnia and HerzegovinaBrazilBulgariaBurma/MyanmarCabo VerdeCambodiaCameroonCanadaCaribbeanCentral AmericaChileChinaColombiaCongoCosta RicaCroatiaCubaCzechoslovakiaDenmarkDominicaDominican RepublicEastern AfricaEastern AsiaEastern EuropeEcuadorEgyptEl SalvadorEnglandEritreaEthiopiaEuropeFijiFranceGermanyGhanaGreeceGrenadaGuatemalaGuyanaHaitiHondurasHong KongHungaryIndiaIndonesiaIranIraqIrelandIsraelItalyJamaicaJapanJordanKazakhstanKenyaKoreaKuwaitLaosLatin AmericaLatviaLebanonLiberiaLithuaniaMalaysiaMexicoMicronesiaMiddle AfricaMoldovaMoroccoNepalNetherlandsNicaraguaNigeriaNorth AmericaNorth MacedoniaNorthern AfricaNorthern EuropeNorwayOceaniaPakistanPanamaPeruPhilippinesPolandPortugalRomaniaRussiaSaudi ArabiaScotlandSenegalSerbiaSierra LeoneSingaporeSomaliaSouth AfricaSouth AmericaSouth Central AsiaSouth Eastern AsiaSouthern EuropeSpainSri LankaSt. Vincent and the GrenadinesSudanSwedenSwitzerlandSyriaTaiwanThailandTrinidad and TobagoTurkeyUgandaUkraineUruguayUzbekistanVenezuelaVietnamWest IndiesWestern AfricaWestern AsiaWestern EuropeYemenZaireZimbabweAzores
Divorced or Separated
Income
Poverty
Unemployment
Labor Participation
Family Structure
Vehicle Availability
Education Level
Disability

Divorced or Separated Comparison

Pennsylvania Germans

Nonimmigrants

Average
Tragic
12.1%
DIVORCED OR SEPARATED
48.9/ 100
METRIC RATING
176th/ 347
METRIC RANK
12.8%
DIVORCED OR SEPARATED
0.1/ 100
METRIC RATING
284th/ 347
METRIC RANK

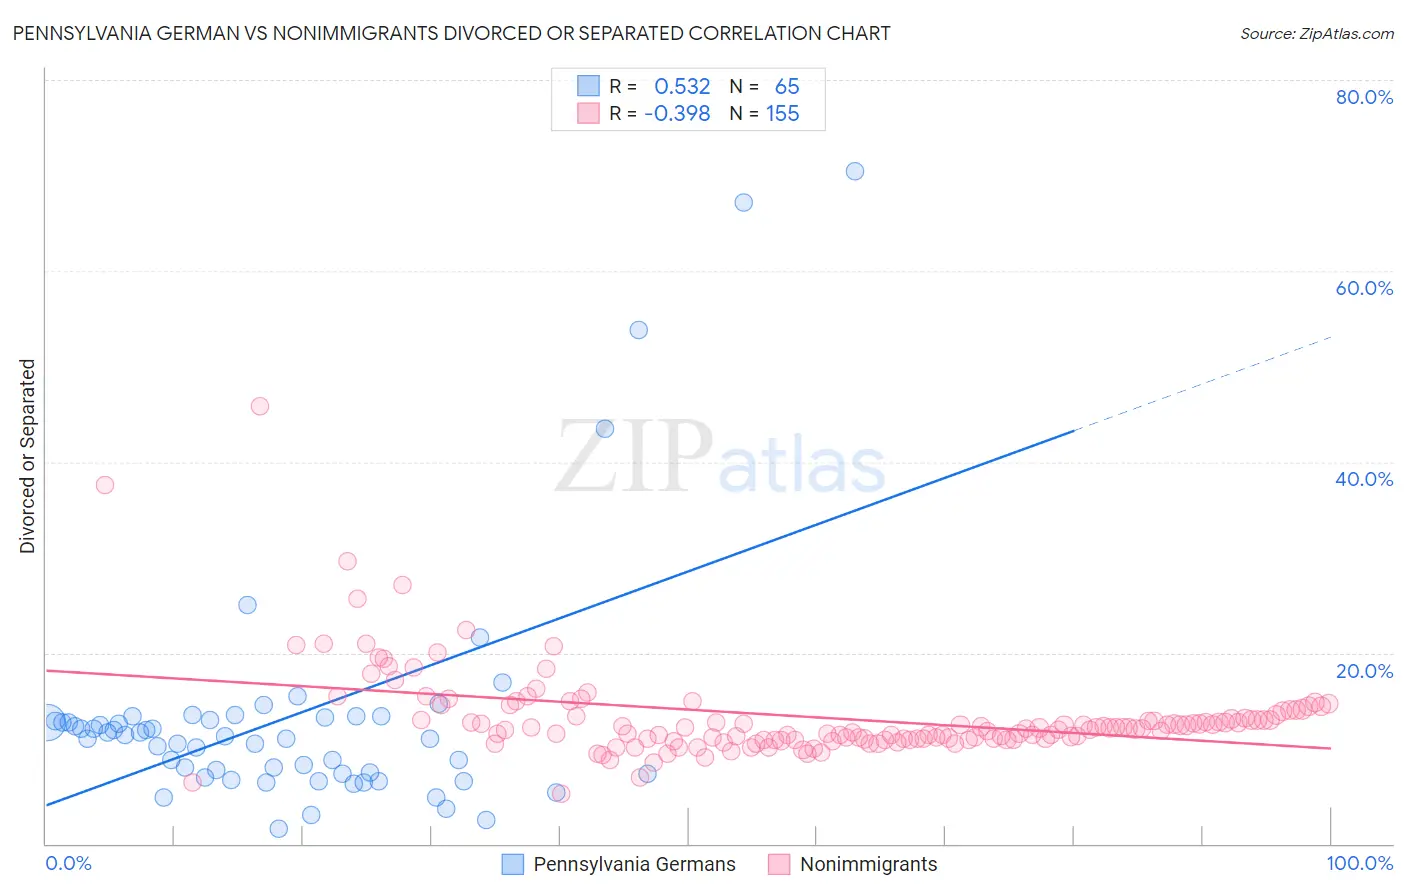
Pennsylvania German vs Nonimmigrants Divorced or Separated Correlation Chart

The statistical analysis conducted on geographies consisting of 234,077,990 people shows a substantial positive correlation between the proportion of Pennsylvania Germans and percentage of population currently divorced or separated in the United States with a correlation coefficient (R) of 0.532 and weighted average of 12.1%. Similarly, the statistical analysis conducted on geographies consisting of 584,532,053 people shows a mild negative correlation between the proportion of Nonimmigrants and percentage of population currently divorced or separated in the United States with a correlation coefficient (R) of -0.398 and weighted average of 12.8%, a difference of 5.7%.
Pennsylvania German vs Nonimmigrants Divorced or Separated

Divorced or Separated Correlation Summary

MeasurementPennsylvania GermanNonimmigrants
Minimum1.6%5.3%
Maximum70.4%45.8%
Range68.8%40.5%
Mean13.3%13.2%
Median11.2%12.1%
Interquartile 25% (IQ1)7.3%10.9%
Interquartile 75% (IQ3)13.1%13.5%
Interquartile Range (IQR)5.8%2.6%
Standard Deviation (Sample)12.7%4.8%
Standard Deviation (Population)12.6%4.8%

Similar Demographics by Divorced or Separated

Demographics Similar to Pennsylvania Germans by Divorced or Separated

In terms of divorced or separated, the demographic groups most similar to Pennsylvania Germans are Hawaiian (12.1%, a difference of 0.040%), Immigrants from Sierra Leone (12.1%, a difference of 0.040%), Brazilian (12.1%, a difference of 0.040%), Immigrants from Moldova (12.1%, a difference of 0.050%), and Ghanaian (12.1%, a difference of 0.11%).
DemographicsRating | RankDivorced or Separated
Immigrants | Peru
57.0
/100
|
#169
Average
12.0%
Mexican American Indians
55.8
/100
|
#170
Average
12.0%
Costa Ricans
53.3
/100
|
#171
Average
12.0%
Immigrants | Mexico
53.2
/100
|
#172
Average
12.0%
Immigrants | Moldova
50.4
/100
|
#173
Average
12.1%
Hawaiians
50.0
/100
|
#174
Average
12.1%
Immigrants | Sierra Leone
50.0
/100
|
#175
Average
12.1%
Pennsylvania Germans
48.9
/100
|
#176
Average
12.1%
Brazilians
47.7
/100
|
#177
Average
12.1%
Ghanaians
45.9
/100
|
#178
Average
12.1%
Immigrants | Western Europe
45.6
/100
|
#179
Average
12.1%
Barbadians
45.0
/100
|
#180
Average
12.1%
Immigrants | Canada
44.0
/100
|
#181
Average
12.1%
Immigrants | Ethiopia
43.1
/100
|
#182
Average
12.1%
Immigrants | Central America
42.9
/100
|
#183
Average
12.1%

Demographics Similar to Nonimmigrants by Divorced or Separated

In terms of divorced or separated, the demographic groups most similar to Nonimmigrants are French (12.8%, a difference of 0.040%), Delaware (12.7%, a difference of 0.090%), Subsaharan African (12.7%, a difference of 0.10%), Pueblo (12.7%, a difference of 0.22%), and Immigrants from Zaire (12.7%, a difference of 0.26%).
DemographicsRating | RankDivorced or Separated
Dominicans
0.2
/100
|
#277
Tragic
12.7%
Lumbee
0.2
/100
|
#278
Tragic
12.7%
Immigrants | Dominican Republic
0.2
/100
|
#279
Tragic
12.7%
Immigrants | Zaire
0.2
/100
|
#280
Tragic
12.7%
Pueblo
0.2
/100
|
#281
Tragic
12.7%
Sub-Saharan Africans
0.1
/100
|
#282
Tragic
12.7%
Delaware
0.1
/100
|
#283
Tragic
12.7%
Immigrants | Nonimmigrants
0.1
/100
|
#284
Tragic
12.8%
French
0.1
/100
|
#285
Tragic
12.8%
Spanish
0.1
/100
|
#286
Tragic
12.8%
Hondurans
0.1
/100
|
#287
Tragic
12.8%
French Canadians
0.1
/100
|
#288
Tragic
12.8%
Iroquois
0.0
/100
|
#289
Tragic
12.9%
Pima
0.0
/100
|
#290
Tragic
12.9%
Immigrants | Honduras
0.0
/100
|
#291
Tragic
12.9%