Immigrants from Syria vs Creek Divorced or Separated
COMPARE
Immigrants from Syria
Creek
Divorced or Separated
Divorced or Separated Comparison
Immigrants from Syria
Creek
11.4%
DIVORCED OR SEPARATED
99.7/ 100
METRIC RATING
67th/ 347
METRIC RANK
14.4%
DIVORCED OR SEPARATED
0.0/ 100
METRIC RATING
343rd/ 347
METRIC RANK
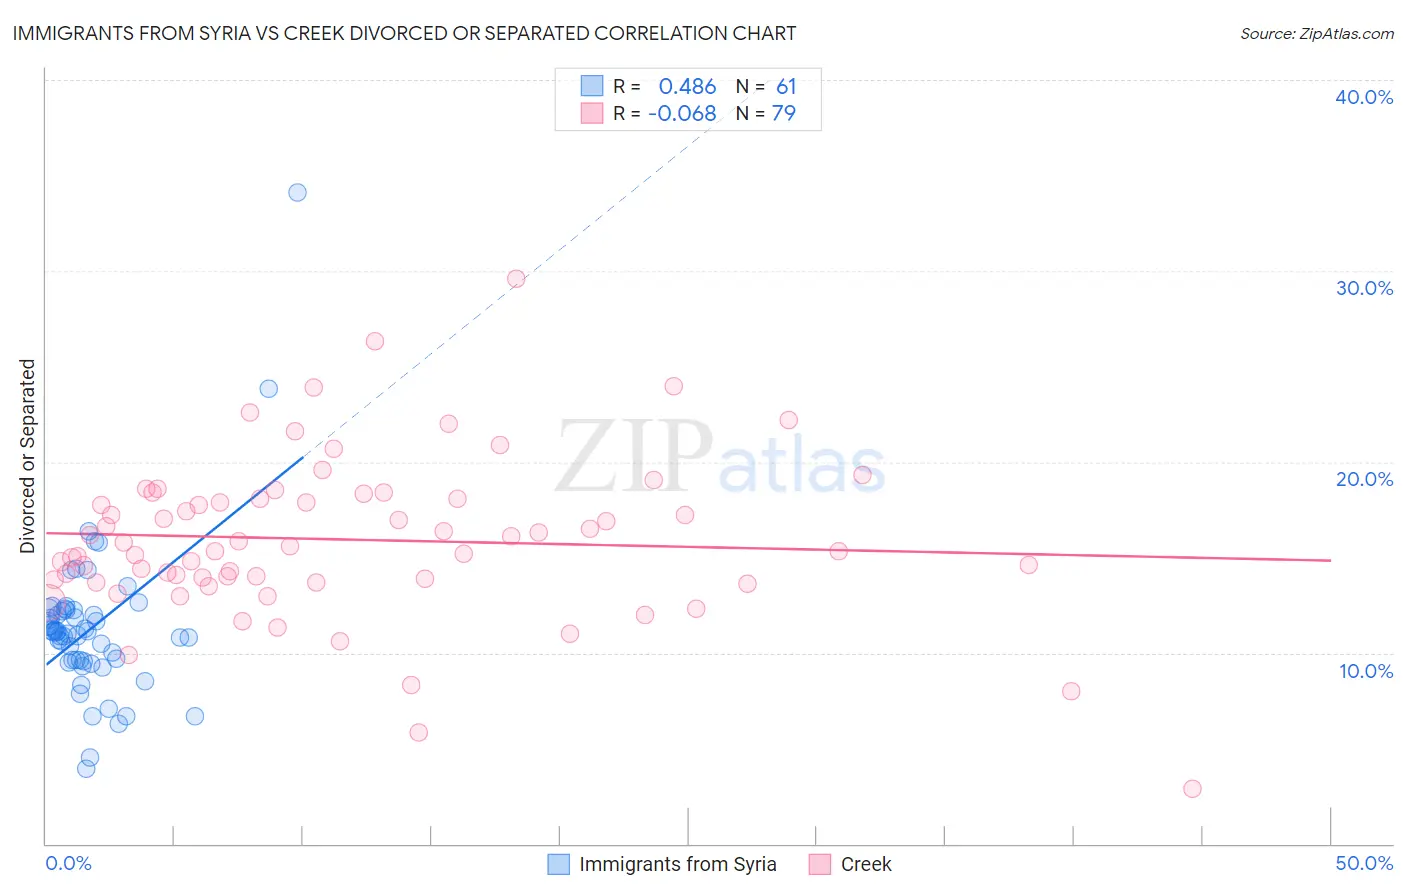
Immigrants from Syria vs Creek Divorced or Separated Correlation Chart
The statistical analysis conducted on geographies consisting of 174,113,022 people shows a moderate positive correlation between the proportion of Immigrants from Syria and percentage of population currently divorced or separated in the United States with a correlation coefficient (R) of 0.486 and weighted average of 11.4%. Similarly, the statistical analysis conducted on geographies consisting of 178,467,072 people shows a slight negative correlation between the proportion of Creek and percentage of population currently divorced or separated in the United States with a correlation coefficient (R) of -0.068 and weighted average of 14.4%, a difference of 26.0%.
Divorced or Separated Correlation Summary
| Measurement | Immigrants from Syria | Creek |
| Minimum | 3.9% | 2.9% |
| Maximum | 34.1% | 29.6% |
| Range | 30.2% | 26.7% |
| Mean | 11.3% | 15.9% |
| Median | 11.1% | 15.6% |
| Interquartile 25% (IQ1) | 9.6% | 13.8% |
| Interquartile 75% (IQ3) | 12.2% | 18.1% |
| Interquartile Range (IQR) | 2.6% | 4.3% |
| Standard Deviation (Sample) | 4.2% | 4.2% |
| Standard Deviation (Population) | 4.2% | 4.2% |
Similar Demographics by Divorced or Separated
Demographics Similar to Immigrants from Syria by Divorced or Separated
In terms of divorced or separated, the demographic groups most similar to Immigrants from Syria are Inupiat (11.4%, a difference of 0.090%), Palestinian (11.5%, a difference of 0.11%), Immigrants from Belgium (11.5%, a difference of 0.11%), Immigrants from Eastern Europe (11.5%, a difference of 0.13%), and Immigrants from South Eastern Asia (11.4%, a difference of 0.23%).
| Demographics | Rating | Rank | Divorced or Separated |
| Immigrants | Russia | 99.9 /100 | #60 | Exceptional 11.3% |
| Koreans | 99.9 /100 | #61 | Exceptional 11.3% |
| Luxembourgers | 99.9 /100 | #62 | Exceptional 11.3% |
| Immigrants | Kuwait | 99.9 /100 | #63 | Exceptional 11.3% |
| Macedonians | 99.8 /100 | #64 | Exceptional 11.4% |
| Immigrants | South Eastern Asia | 99.8 /100 | #65 | Exceptional 11.4% |
| Inupiat | 99.8 /100 | #66 | Exceptional 11.4% |
| Immigrants | Syria | 99.7 /100 | #67 | Exceptional 11.4% |
| Palestinians | 99.7 /100 | #68 | Exceptional 11.5% |
| Immigrants | Belgium | 99.7 /100 | #69 | Exceptional 11.5% |
| Immigrants | Eastern Europe | 99.7 /100 | #70 | Exceptional 11.5% |
| Paraguayans | 99.7 /100 | #71 | Exceptional 11.5% |
| Jordanians | 99.6 /100 | #72 | Exceptional 11.5% |
| Immigrants | North Macedonia | 99.6 /100 | #73 | Exceptional 11.5% |
| Taiwanese | 99.6 /100 | #74 | Exceptional 11.5% |
Demographics Similar to Creek by Divorced or Separated
In terms of divorced or separated, the demographic groups most similar to Creek are Cuban (14.5%, a difference of 0.68%), Kiowa (14.5%, a difference of 0.77%), Seminole (14.3%, a difference of 1.1%), Bahamian (14.2%, a difference of 1.2%), and Chickasaw (14.2%, a difference of 1.4%).
| Demographics | Rating | Rank | Divorced or Separated |
| Puerto Ricans | 0.0 /100 | #333 | Tragic 13.9% |
| Immigrants | Bahamas | 0.0 /100 | #334 | Tragic 13.9% |
| Dutch West Indians | 0.0 /100 | #335 | Tragic 14.0% |
| Shoshone | 0.0 /100 | #336 | Tragic 14.0% |
| Crow | 0.0 /100 | #337 | Tragic 14.1% |
| Choctaw | 0.0 /100 | #338 | Tragic 14.1% |
| Colville | 0.0 /100 | #339 | Tragic 14.2% |
| Chickasaw | 0.0 /100 | #340 | Tragic 14.2% |
| Bahamians | 0.0 /100 | #341 | Tragic 14.2% |
| Seminole | 0.0 /100 | #342 | Tragic 14.3% |
| Creek | 0.0 /100 | #343 | Tragic 14.4% |
| Cubans | 0.0 /100 | #344 | Tragic 14.5% |
| Kiowa | 0.0 /100 | #345 | Tragic 14.5% |
| Arapaho | 0.0 /100 | #346 | Tragic 14.8% |
| Immigrants | Cuba | 0.0 /100 | #347 | Tragic 15.2% |