Paiute vs Mexican Average Family Size
COMPARE
Paiute
Mexican
Average Family Size
Average Family Size Comparison
Paiute
Mexicans
3.29
AVERAGE FAMILY SIZE
98.0/ 100
METRIC RATING
106th/ 347
METRIC RANK
3.48
AVERAGE FAMILY SIZE
100.0/ 100
METRIC RATING
19th/ 347
METRIC RANK
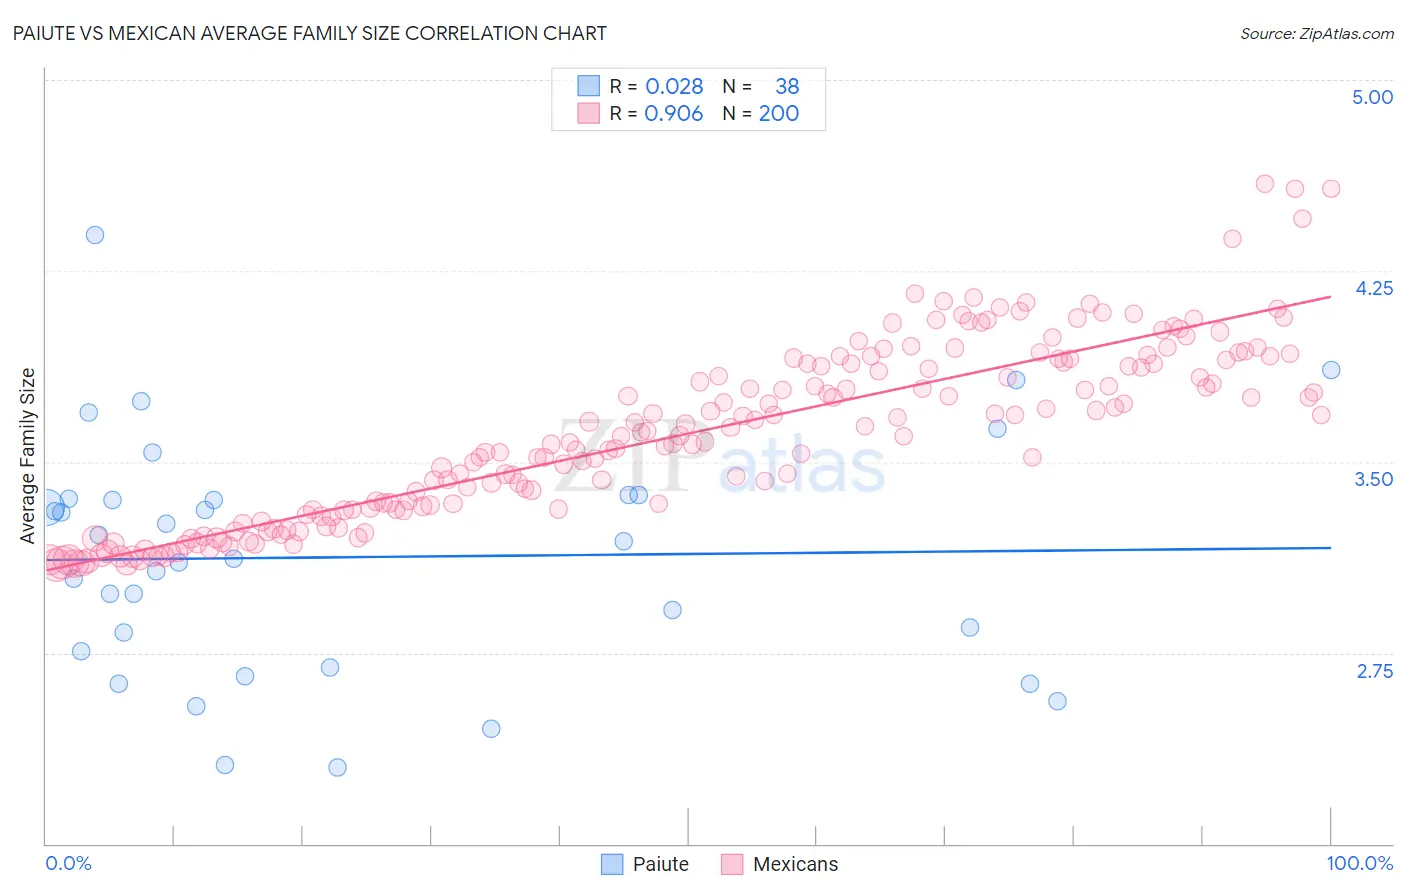
Paiute vs Mexican Average Family Size Correlation Chart
The statistical analysis conducted on geographies consisting of 58,392,138 people shows no correlation between the proportion of Paiute and average family size in the United States with a correlation coefficient (R) of 0.028 and weighted average of 3.29. Similarly, the statistical analysis conducted on geographies consisting of 564,667,700 people shows a near-perfect positive correlation between the proportion of Mexicans and average family size in the United States with a correlation coefficient (R) of 0.906 and weighted average of 3.48, a difference of 5.8%.
Average Family Size Correlation Summary
| Measurement | Paiute | Mexican |
| Minimum | 2.30 | 3.09 |
| Maximum | 4.39 | 4.59 |
| Range | 2.09 | 1.50 |
| Mean | 3.13 | 3.61 |
| Median | 3.15 | 3.60 |
| Interquartile 25% (IQ1) | 2.76 | 3.31 |
| Interquartile 75% (IQ3) | 3.35 | 3.89 |
| Interquartile Range (IQR) | 0.60 | 0.58 |
| Standard Deviation (Sample) | 0.46 | 0.34 |
| Standard Deviation (Population) | 0.46 | 0.34 |
Similar Demographics by Average Family Size
Demographics Similar to Paiute by Average Family Size
In terms of average family size, the demographic groups most similar to Paiute are Immigrants from Ghana (3.29, a difference of 0.020%), Ghanaian (3.29, a difference of 0.020%), Bolivian (3.29, a difference of 0.070%), Immigrants from Western Africa (3.29, a difference of 0.11%), and West Indian (3.29, a difference of 0.13%).
| Demographics | Rating | Rank | Average Family Size |
| Nigerians | 98.6 /100 | #99 | Exceptional 3.29 |
| Guamanians/Chamorros | 98.6 /100 | #100 | Exceptional 3.29 |
| Immigrants | Burma/Myanmar | 98.6 /100 | #101 | Exceptional 3.29 |
| West Indians | 98.5 /100 | #102 | Exceptional 3.29 |
| Immigrants | Western Africa | 98.4 /100 | #103 | Exceptional 3.29 |
| Bolivians | 98.3 /100 | #104 | Exceptional 3.29 |
| Immigrants | Ghana | 98.1 /100 | #105 | Exceptional 3.29 |
| Paiute | 98.0 /100 | #106 | Exceptional 3.29 |
| Ghanaians | 98.0 /100 | #107 | Exceptional 3.29 |
| Asians | 97.0 /100 | #108 | Exceptional 3.28 |
| Puerto Ricans | 96.7 /100 | #109 | Exceptional 3.28 |
| Bahamians | 96.6 /100 | #110 | Exceptional 3.28 |
| Indonesians | 96.2 /100 | #111 | Exceptional 3.28 |
| Blacks/African Americans | 95.7 /100 | #112 | Exceptional 3.27 |
| Immigrants | Panama | 95.6 /100 | #113 | Exceptional 3.27 |
Demographics Similar to Mexicans by Average Family Size
In terms of average family size, the demographic groups most similar to Mexicans are Cheyenne (3.47, a difference of 0.040%), Salvadoran (3.48, a difference of 0.070%), Yuman (3.47, a difference of 0.30%), Immigrants from El Salvador (3.49, a difference of 0.32%), and Apache (3.46, a difference of 0.35%).
| Demographics | Rating | Rank | Average Family Size |
| Immigrants | Mexico | 100.0 /100 | #12 | Exceptional 3.52 |
| Sioux | 100.0 /100 | #13 | Exceptional 3.52 |
| Immigrants | Central America | 100.0 /100 | #14 | Exceptional 3.49 |
| Tongans | 100.0 /100 | #15 | Exceptional 3.49 |
| Ute | 100.0 /100 | #16 | Exceptional 3.49 |
| Immigrants | El Salvador | 100.0 /100 | #17 | Exceptional 3.49 |
| Salvadorans | 100.0 /100 | #18 | Exceptional 3.48 |
| Mexicans | 100.0 /100 | #19 | Exceptional 3.48 |
| Cheyenne | 100.0 /100 | #20 | Exceptional 3.47 |
| Yuman | 100.0 /100 | #21 | Exceptional 3.47 |
| Apache | 100.0 /100 | #22 | Exceptional 3.46 |
| Immigrants | Fiji | 100.0 /100 | #23 | Exceptional 3.45 |
| Natives/Alaskans | 100.0 /100 | #24 | Exceptional 3.45 |
| Yakama | 100.0 /100 | #25 | Exceptional 3.45 |
| Native Hawaiians | 100.0 /100 | #26 | Exceptional 3.43 |