Paiute vs Immigrants from Costa Rica Average Family Size
COMPARE
Paiute
Immigrants from Costa Rica
Average Family Size
Average Family Size Comparison
Paiute
Immigrants from Costa Rica
3.29
AVERAGE FAMILY SIZE
98.0/ 100
METRIC RATING
106th/ 347
METRIC RANK
3.26
AVERAGE FAMILY SIZE
90.7/ 100
METRIC RATING
126th/ 347
METRIC RANK
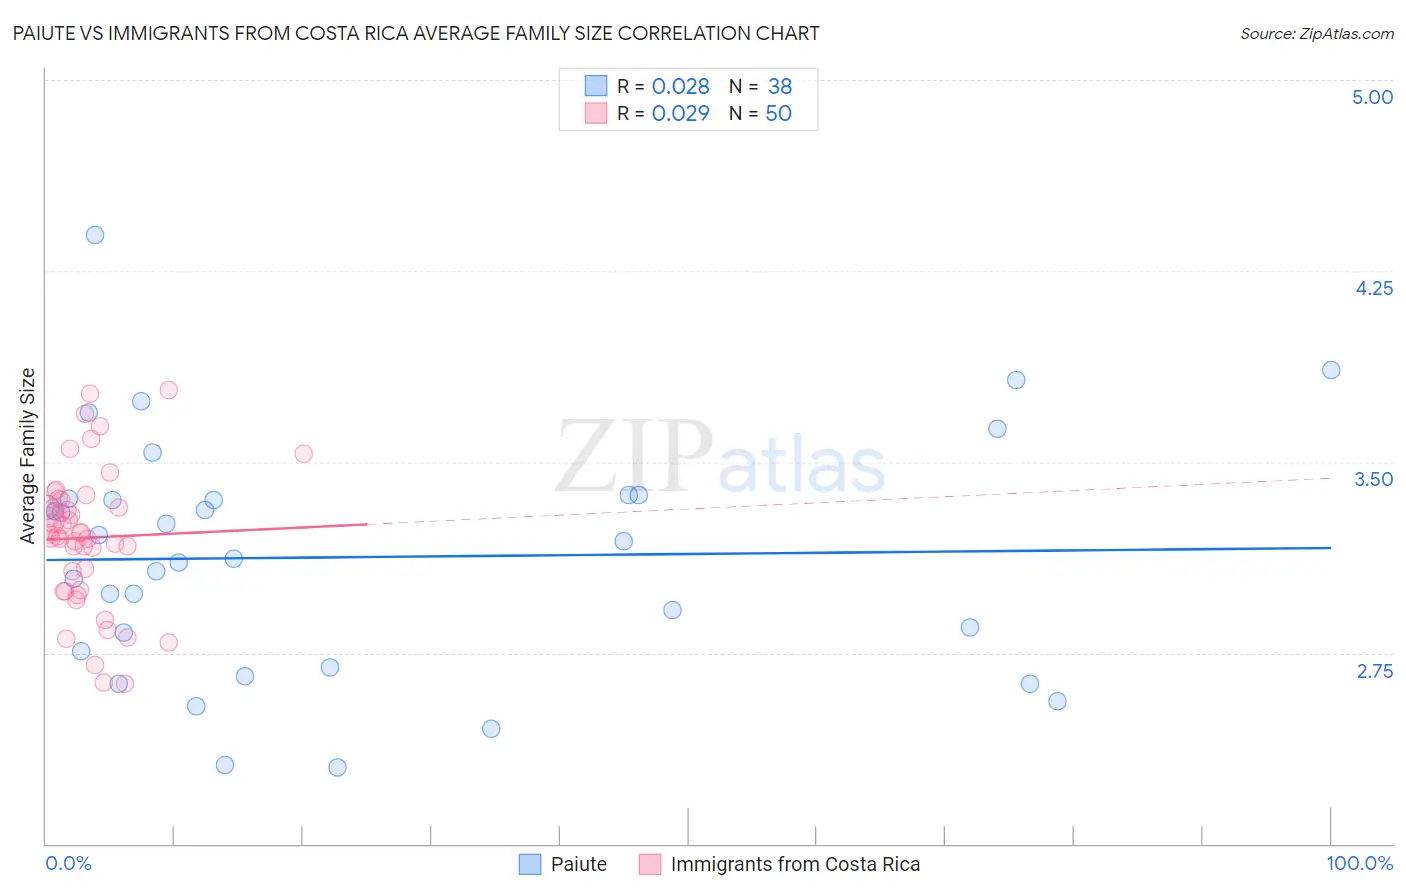
Paiute vs Immigrants from Costa Rica Average Family Size Correlation Chart
The statistical analysis conducted on geographies consisting of 58,392,138 people shows no correlation between the proportion of Paiute and average family size in the United States with a correlation coefficient (R) of 0.028 and weighted average of 3.29. Similarly, the statistical analysis conducted on geographies consisting of 204,251,224 people shows no correlation between the proportion of Immigrants from Costa Rica and average family size in the United States with a correlation coefficient (R) of 0.029 and weighted average of 3.26, a difference of 0.74%.
Average Family Size Correlation Summary
| Measurement | Paiute | Immigrants from Costa Rica |
| Minimum | 2.30 | 2.63 |
| Maximum | 4.39 | 3.78 |
| Range | 2.09 | 1.15 |
| Mean | 3.13 | 3.20 |
| Median | 3.15 | 3.21 |
| Interquartile 25% (IQ1) | 2.76 | 2.99 |
| Interquartile 75% (IQ3) | 3.35 | 3.35 |
| Interquartile Range (IQR) | 0.60 | 0.36 |
| Standard Deviation (Sample) | 0.46 | 0.27 |
| Standard Deviation (Population) | 0.46 | 0.27 |
Demographics Similar to Paiute and Immigrants from Costa Rica by Average Family Size
In terms of average family size, the demographic groups most similar to Paiute are Ghanaian (3.29, a difference of 0.020%), Asian (3.28, a difference of 0.19%), Puerto Rican (3.28, a difference of 0.24%), Bahamian (3.28, a difference of 0.26%), and Indonesian (3.28, a difference of 0.30%). Similarly, the demographic groups most similar to Immigrants from Costa Rica are Immigrants from Cuba (3.26, a difference of 0.030%), South American Indian (3.26, a difference of 0.050%), Alaskan Athabascan (3.27, a difference of 0.10%), Immigrants from Colombia (3.27, a difference of 0.12%), and Immigrants from Thailand (3.27, a difference of 0.16%).
| Demographics | Rating | Rank | Average Family Size |
| Paiute | 98.0 /100 | #106 | Exceptional 3.29 |
| Ghanaians | 98.0 /100 | #107 | Exceptional 3.29 |
| Asians | 97.0 /100 | #108 | Exceptional 3.28 |
| Puerto Ricans | 96.7 /100 | #109 | Exceptional 3.28 |
| Bahamians | 96.6 /100 | #110 | Exceptional 3.28 |
| Indonesians | 96.2 /100 | #111 | Exceptional 3.28 |
| Blacks/African Americans | 95.7 /100 | #112 | Exceptional 3.27 |
| Immigrants | Panama | 95.6 /100 | #113 | Exceptional 3.27 |
| South Americans | 95.1 /100 | #114 | Exceptional 3.27 |
| Immigrants | Liberia | 95.0 /100 | #115 | Exceptional 3.27 |
| Immigrants | South America | 95.0 /100 | #116 | Exceptional 3.27 |
| Kiowa | 94.8 /100 | #117 | Exceptional 3.27 |
| Immigrants | Asia | 94.0 /100 | #118 | Exceptional 3.27 |
| Immigrants | Indonesia | 93.7 /100 | #119 | Exceptional 3.27 |
| Immigrants | Bahamas | 93.6 /100 | #120 | Exceptional 3.27 |
| Immigrants | Thailand | 93.3 /100 | #121 | Exceptional 3.27 |
| Immigrants | Colombia | 92.8 /100 | #122 | Exceptional 3.27 |
| Alaskan Athabascans | 92.4 /100 | #123 | Exceptional 3.27 |
| South American Indians | 91.6 /100 | #124 | Exceptional 3.26 |
| Immigrants | Cuba | 91.3 /100 | #125 | Exceptional 3.26 |
| Immigrants | Costa Rica | 90.7 /100 | #126 | Exceptional 3.26 |