Colville vs Mexican Average Family Size
COMPARE
Colville
Mexican
Average Family Size
Average Family Size Comparison
Colville
Mexicans
3.14
AVERAGE FAMILY SIZE
0.2/ 100
METRIC RATING
298th/ 347
METRIC RANK
3.48
AVERAGE FAMILY SIZE
100.0/ 100
METRIC RATING
19th/ 347
METRIC RANK
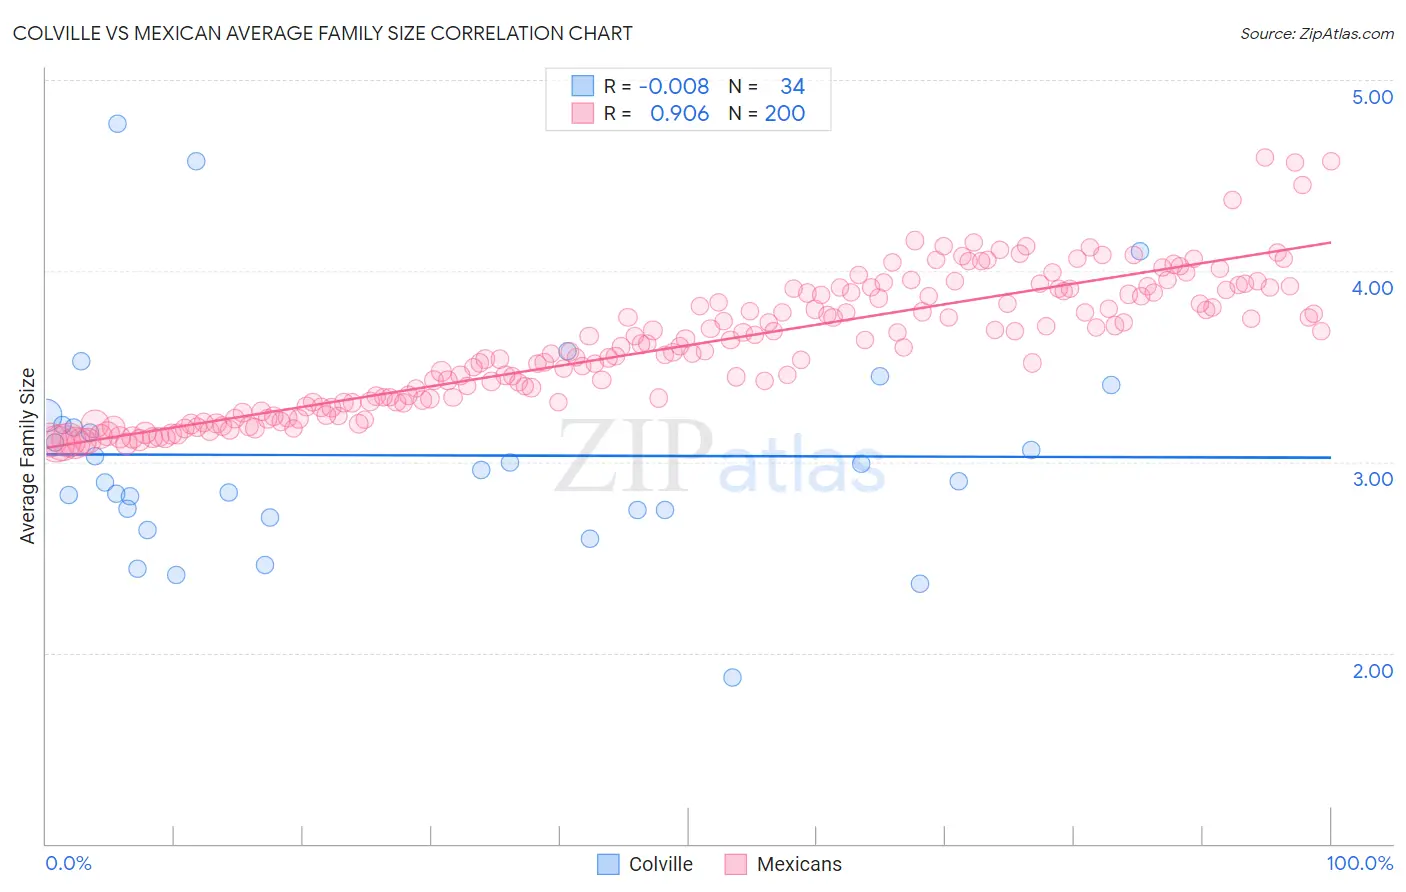
Colville vs Mexican Average Family Size Correlation Chart
The statistical analysis conducted on geographies consisting of 34,682,970 people shows no correlation between the proportion of Colville and average family size in the United States with a correlation coefficient (R) of -0.008 and weighted average of 3.14. Similarly, the statistical analysis conducted on geographies consisting of 564,667,700 people shows a near-perfect positive correlation between the proportion of Mexicans and average family size in the United States with a correlation coefficient (R) of 0.906 and weighted average of 3.48, a difference of 10.8%.
Average Family Size Correlation Summary
| Measurement | Colville | Mexican |
| Minimum | 1.87 | 3.09 |
| Maximum | 4.77 | 4.59 |
| Range | 2.90 | 1.50 |
| Mean | 3.03 | 3.61 |
| Median | 2.93 | 3.60 |
| Interquartile 25% (IQ1) | 2.75 | 3.31 |
| Interquartile 75% (IQ3) | 3.20 | 3.89 |
| Interquartile Range (IQR) | 0.45 | 0.58 |
| Standard Deviation (Sample) | 0.58 | 0.34 |
| Standard Deviation (Population) | 0.58 | 0.34 |
Similar Demographics by Average Family Size
Demographics Similar to Colville by Average Family Size
In terms of average family size, the demographic groups most similar to Colville are Immigrants from Western Europe (3.14, a difference of 0.0%), Immigrants from Croatia (3.14, a difference of 0.010%), Austrian (3.14, a difference of 0.010%), Ukrainian (3.14, a difference of 0.010%), and Scandinavian (3.14, a difference of 0.030%).
| Demographics | Rating | Rank | Average Family Size |
| Alsatians | 0.2 /100 | #291 | Tragic 3.14 |
| Europeans | 0.2 /100 | #292 | Tragic 3.14 |
| Scandinavians | 0.2 /100 | #293 | Tragic 3.14 |
| Immigrants | Croatia | 0.2 /100 | #294 | Tragic 3.14 |
| Austrians | 0.2 /100 | #295 | Tragic 3.14 |
| Ukrainians | 0.2 /100 | #296 | Tragic 3.14 |
| Immigrants | Western Europe | 0.2 /100 | #297 | Tragic 3.14 |
| Colville | 0.2 /100 | #298 | Tragic 3.14 |
| Canadians | 0.2 /100 | #299 | Tragic 3.14 |
| Immigrants | Sweden | 0.2 /100 | #300 | Tragic 3.14 |
| Macedonians | 0.2 /100 | #301 | Tragic 3.13 |
| Immigrants | Latvia | 0.2 /100 | #302 | Tragic 3.13 |
| British | 0.2 /100 | #303 | Tragic 3.13 |
| Immigrants | Switzerland | 0.2 /100 | #304 | Tragic 3.13 |
| Australians | 0.1 /100 | #305 | Tragic 3.13 |
Demographics Similar to Mexicans by Average Family Size
In terms of average family size, the demographic groups most similar to Mexicans are Cheyenne (3.47, a difference of 0.040%), Salvadoran (3.48, a difference of 0.070%), Yuman (3.47, a difference of 0.30%), Immigrants from El Salvador (3.49, a difference of 0.32%), and Apache (3.46, a difference of 0.35%).
| Demographics | Rating | Rank | Average Family Size |
| Immigrants | Mexico | 100.0 /100 | #12 | Exceptional 3.52 |
| Sioux | 100.0 /100 | #13 | Exceptional 3.52 |
| Immigrants | Central America | 100.0 /100 | #14 | Exceptional 3.49 |
| Tongans | 100.0 /100 | #15 | Exceptional 3.49 |
| Ute | 100.0 /100 | #16 | Exceptional 3.49 |
| Immigrants | El Salvador | 100.0 /100 | #17 | Exceptional 3.49 |
| Salvadorans | 100.0 /100 | #18 | Exceptional 3.48 |
| Mexicans | 100.0 /100 | #19 | Exceptional 3.48 |
| Cheyenne | 100.0 /100 | #20 | Exceptional 3.47 |
| Yuman | 100.0 /100 | #21 | Exceptional 3.47 |
| Apache | 100.0 /100 | #22 | Exceptional 3.46 |
| Immigrants | Fiji | 100.0 /100 | #23 | Exceptional 3.45 |
| Natives/Alaskans | 100.0 /100 | #24 | Exceptional 3.45 |
| Yakama | 100.0 /100 | #25 | Exceptional 3.45 |
| Native Hawaiians | 100.0 /100 | #26 | Exceptional 3.43 |