Okinawan vs Immigrants from Eastern Africa Family Households
COMPARE
Okinawan
Immigrants from Eastern Africa
Family Households
Family Households Comparison
Okinawans
Immigrants from Eastern Africa
62.5%
FAMILY HOUSEHOLDS
0.0/ 100
METRIC RATING
295th/ 347
METRIC RANK
61.1%
FAMILY HOUSEHOLDS
0.0/ 100
METRIC RATING
334th/ 347
METRIC RANK
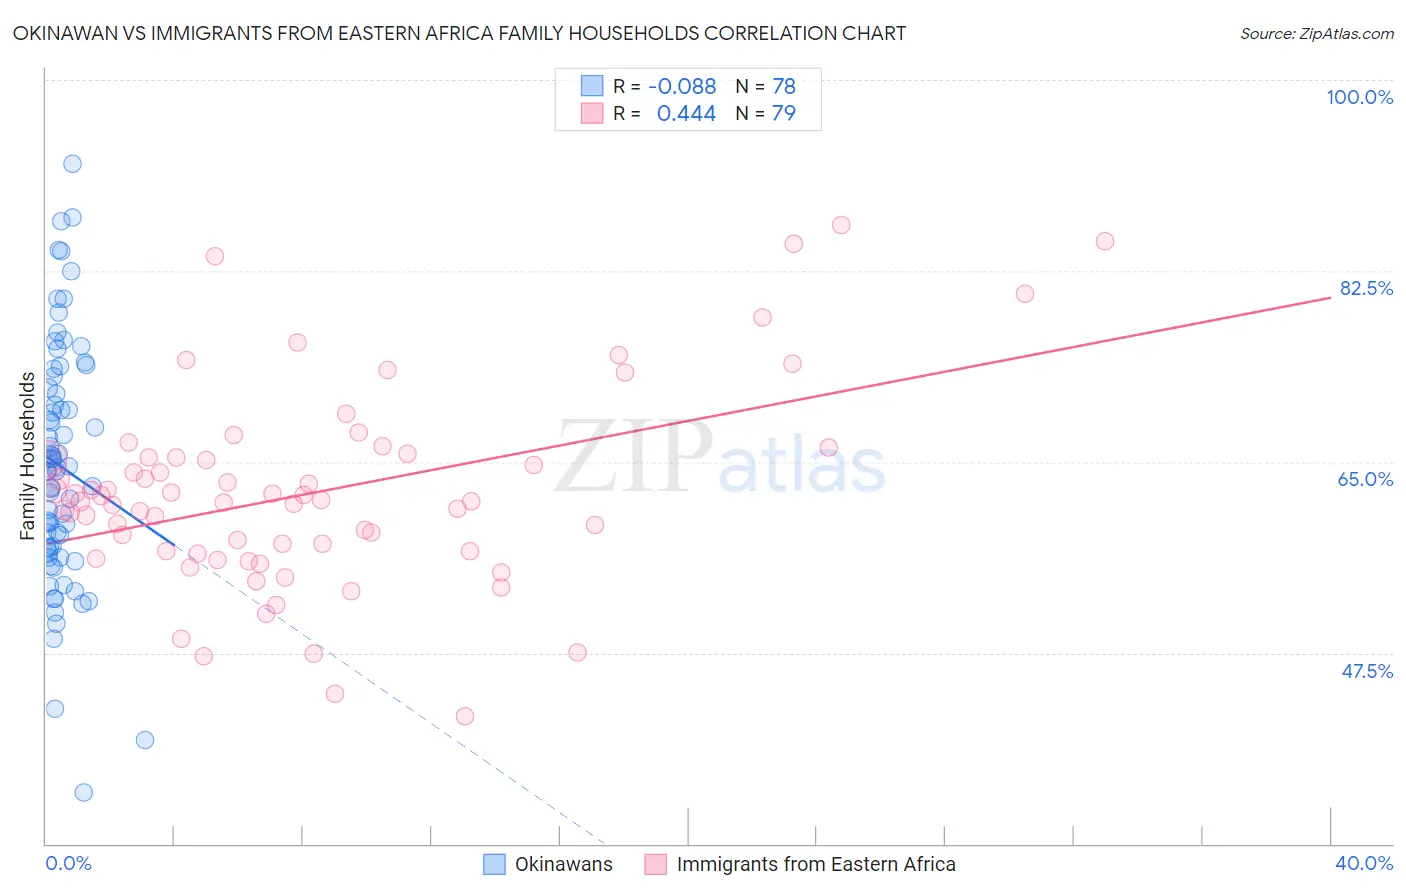
Okinawan vs Immigrants from Eastern Africa Family Households Correlation Chart
The statistical analysis conducted on geographies consisting of 73,730,416 people shows a slight negative correlation between the proportion of Okinawans and percentage of family households in the United States with a correlation coefficient (R) of -0.088 and weighted average of 62.5%. Similarly, the statistical analysis conducted on geographies consisting of 354,874,836 people shows a moderate positive correlation between the proportion of Immigrants from Eastern Africa and percentage of family households in the United States with a correlation coefficient (R) of 0.444 and weighted average of 61.1%, a difference of 2.1%.
Family Households Correlation Summary
| Measurement | Okinawan | Immigrants from Eastern Africa |
| Minimum | 34.7% | 41.7% |
| Maximum | 92.3% | 86.7% |
| Range | 57.6% | 45.0% |
| Mean | 64.6% | 62.2% |
| Median | 64.3% | 61.4% |
| Interquartile 25% (IQ1) | 57.1% | 56.8% |
| Interquartile 75% (IQ3) | 71.8% | 65.4% |
| Interquartile Range (IQR) | 14.6% | 8.6% |
| Standard Deviation (Sample) | 11.1% | 9.1% |
| Standard Deviation (Population) | 11.0% | 9.0% |
Similar Demographics by Family Households
Demographics Similar to Okinawans by Family Households
In terms of family households, the demographic groups most similar to Okinawans are Barbadian (62.5%, a difference of 0.010%), Slovene (62.4%, a difference of 0.010%), French American Indian (62.4%, a difference of 0.020%), Immigrants from Spain (62.4%, a difference of 0.050%), and Immigrants from Sweden (62.5%, a difference of 0.080%).
| Demographics | Rating | Rank | Family Households |
| Immigrants | Uganda | 0.1 /100 | #288 | Tragic 62.7% |
| Immigrants | Nepal | 0.1 /100 | #289 | Tragic 62.7% |
| Immigrants | Grenada | 0.0 /100 | #290 | Tragic 62.6% |
| U.S. Virgin Islanders | 0.0 /100 | #291 | Tragic 62.6% |
| Immigrants | Burma/Myanmar | 0.0 /100 | #292 | Tragic 62.6% |
| Immigrants | Sweden | 0.0 /100 | #293 | Tragic 62.5% |
| Barbadians | 0.0 /100 | #294 | Tragic 62.5% |
| Okinawans | 0.0 /100 | #295 | Tragic 62.5% |
| Slovenes | 0.0 /100 | #296 | Tragic 62.4% |
| French American Indians | 0.0 /100 | #297 | Tragic 62.4% |
| Immigrants | Spain | 0.0 /100 | #298 | Tragic 62.4% |
| Immigrants | Kuwait | 0.0 /100 | #299 | Tragic 62.4% |
| Immigrants | Africa | 0.0 /100 | #300 | Tragic 62.4% |
| Immigrants | Albania | 0.0 /100 | #301 | Tragic 62.4% |
| Immigrants | Kenya | 0.0 /100 | #302 | Tragic 62.3% |
Demographics Similar to Immigrants from Eastern Africa by Family Households
In terms of family households, the demographic groups most similar to Immigrants from Eastern Africa are Immigrants from Ethiopia (61.2%, a difference of 0.080%), Carpatho Rusyn (61.1%, a difference of 0.12%), Ethiopian (61.2%, a difference of 0.16%), Immigrants from Australia (61.3%, a difference of 0.24%), and Immigrants from France (61.3%, a difference of 0.24%).
| Demographics | Rating | Rank | Family Households |
| Blacks/African Americans | 0.0 /100 | #327 | Tragic 61.5% |
| Kiowa | 0.0 /100 | #328 | Tragic 61.4% |
| Cambodians | 0.0 /100 | #329 | Tragic 61.4% |
| Immigrants | Australia | 0.0 /100 | #330 | Tragic 61.3% |
| Immigrants | France | 0.0 /100 | #331 | Tragic 61.3% |
| Ethiopians | 0.0 /100 | #332 | Tragic 61.2% |
| Immigrants | Ethiopia | 0.0 /100 | #333 | Tragic 61.2% |
| Immigrants | Eastern Africa | 0.0 /100 | #334 | Tragic 61.1% |
| Carpatho Rusyns | 0.0 /100 | #335 | Tragic 61.1% |
| German Russians | 0.0 /100 | #336 | Tragic 60.9% |
| Soviet Union | 0.0 /100 | #337 | Tragic 60.9% |
| Immigrants | Eritrea | 0.0 /100 | #338 | Tragic 60.8% |
| Immigrants | Saudi Arabia | 0.0 /100 | #339 | Tragic 60.7% |
| Immigrants | Sudan | 0.0 /100 | #340 | Tragic 60.2% |
| Immigrants | Senegal | 0.0 /100 | #341 | Tragic 60.1% |