Mexican American Indian vs Guamanian/Chamorro Births to Unmarried Women
COMPARE
Mexican American Indian
Guamanian/Chamorro
Births to Unmarried Women
Births to Unmarried Women Comparison
Mexican American Indians
Guamanians/Chamorros
35.7%
BIRTHS TO UNMARRIED WOMEN
0.4/ 100
METRIC RATING
250th/ 347
METRIC RANK
31.6%
BIRTHS TO UNMARRIED WOMEN
51.3/ 100
METRIC RATING
170th/ 347
METRIC RANK
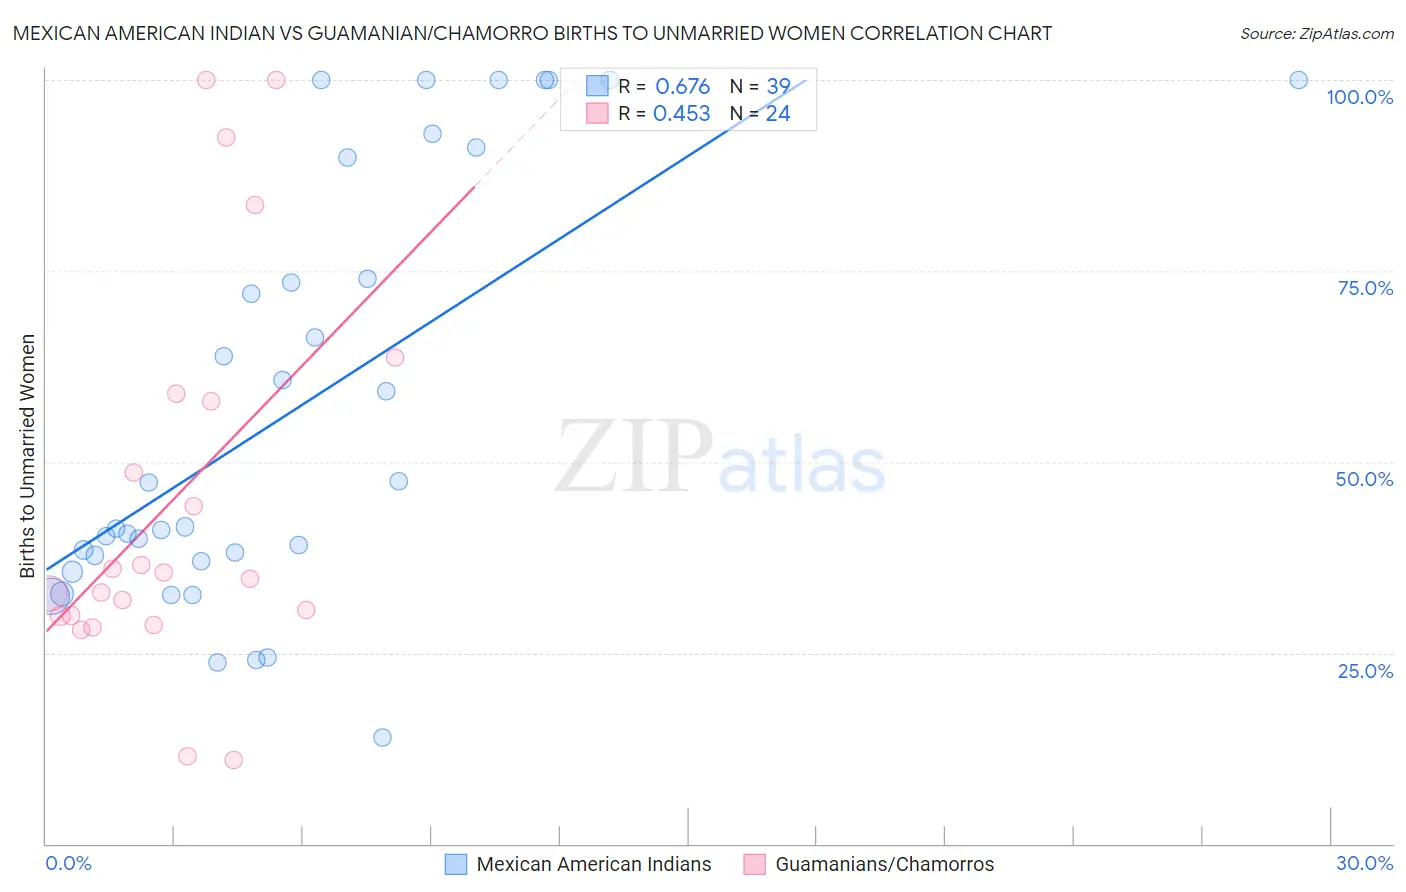
Mexican American Indian vs Guamanian/Chamorro Births to Unmarried Women Correlation Chart
The statistical analysis conducted on geographies consisting of 305,475,949 people shows a significant positive correlation between the proportion of Mexican American Indians and percentage of births to unmarried women in the United States with a correlation coefficient (R) of 0.676 and weighted average of 35.7%. Similarly, the statistical analysis conducted on geographies consisting of 213,790,025 people shows a moderate positive correlation between the proportion of Guamanians/Chamorros and percentage of births to unmarried women in the United States with a correlation coefficient (R) of 0.453 and weighted average of 31.6%, a difference of 13.0%.
Births to Unmarried Women Correlation Summary
| Measurement | Mexican American Indian | Guamanian/Chamorro |
| Minimum | 13.9% | 10.9% |
| Maximum | 100.0% | 100.0% |
| Range | 86.1% | 89.1% |
| Mean | 57.1% | 45.3% |
| Median | 41.5% | 35.1% |
| Interquartile 25% (IQ1) | 36.9% | 29.8% |
| Interquartile 75% (IQ3) | 89.8% | 58.4% |
| Interquartile Range (IQR) | 52.9% | 28.6% |
| Standard Deviation (Sample) | 27.6% | 25.6% |
| Standard Deviation (Population) | 27.2% | 25.1% |
Similar Demographics by Births to Unmarried Women
Demographics Similar to Mexican American Indians by Births to Unmarried Women
In terms of births to unmarried women, the demographic groups most similar to Mexican American Indians are Immigrants from Western Africa (36.0%, a difference of 0.57%), Bermudan (35.5%, a difference of 0.61%), Nonimmigrants (35.5%, a difference of 0.62%), Salvadoran (36.0%, a difference of 0.69%), and Immigrants from Nigeria (35.4%, a difference of 0.96%).
| Demographics | Rating | Rank | Births to Unmarried Women |
| Japanese | 0.9 /100 | #243 | Tragic 35.2% |
| Guyanese | 0.9 /100 | #244 | Tragic 35.2% |
| Shoshone | 0.8 /100 | #245 | Tragic 35.3% |
| Nigerians | 0.7 /100 | #246 | Tragic 35.3% |
| Immigrants | Nigeria | 0.7 /100 | #247 | Tragic 35.4% |
| Immigrants | Nonimmigrants | 0.6 /100 | #248 | Tragic 35.5% |
| Bermudans | 0.6 /100 | #249 | Tragic 35.5% |
| Mexican American Indians | 0.4 /100 | #250 | Tragic 35.7% |
| Immigrants | Western Africa | 0.3 /100 | #251 | Tragic 36.0% |
| Salvadorans | 0.3 /100 | #252 | Tragic 36.0% |
| Immigrants | Portugal | 0.2 /100 | #253 | Tragic 36.2% |
| Potawatomi | 0.2 /100 | #254 | Tragic 36.2% |
| Chickasaw | 0.2 /100 | #255 | Tragic 36.3% |
| Immigrants | Trinidad and Tobago | 0.2 /100 | #256 | Tragic 36.3% |
| Immigrants | Grenada | 0.2 /100 | #257 | Tragic 36.3% |
Demographics Similar to Guamanians/Chamorros by Births to Unmarried Women
In terms of births to unmarried women, the demographic groups most similar to Guamanians/Chamorros are Slavic (31.6%, a difference of 0.070%), Finnish (31.7%, a difference of 0.080%), Immigrants from Eritrea (31.7%, a difference of 0.090%), Belgian (31.6%, a difference of 0.10%), and Immigrants from Yemen (31.7%, a difference of 0.10%).
| Demographics | Rating | Rank | Births to Unmarried Women |
| Immigrants | Chile | 65.7 /100 | #163 | Good 31.2% |
| Hungarians | 64.1 /100 | #164 | Good 31.2% |
| Immigrants | Somalia | 58.1 /100 | #165 | Average 31.4% |
| Peruvians | 55.5 /100 | #166 | Average 31.5% |
| Dutch | 55.3 /100 | #167 | Average 31.5% |
| Belgians | 52.4 /100 | #168 | Average 31.6% |
| Slavs | 52.0 /100 | #169 | Average 31.6% |
| Guamanians/Chamorros | 51.3 /100 | #170 | Average 31.6% |
| Finns | 50.5 /100 | #171 | Average 31.7% |
| Immigrants | Eritrea | 50.4 /100 | #172 | Average 31.7% |
| Immigrants | Yemen | 50.2 /100 | #173 | Average 31.7% |
| Venezuelans | 50.0 /100 | #174 | Average 31.7% |
| Immigrants | Venezuela | 49.2 /100 | #175 | Average 31.7% |
| Scottish | 48.1 /100 | #176 | Average 31.7% |
| South American Indians | 47.7 /100 | #177 | Average 31.7% |