Immigrants from Dominican Republic vs Immigrants from Ecuador Family Households with Children
COMPARE
Immigrants from Dominican Republic
Immigrants from Ecuador
Family Households with Children
Family Households with Children Comparison
Immigrants from Dominican Republic
Immigrants from Ecuador
27.7%
FAMILY HOUSEHOLDS WITH CHILDREN
83.9/ 100
METRIC RATING
137th/ 347
METRIC RANK
27.7%
FAMILY HOUSEHOLDS WITH CHILDREN
84.6/ 100
METRIC RATING
135th/ 347
METRIC RANK
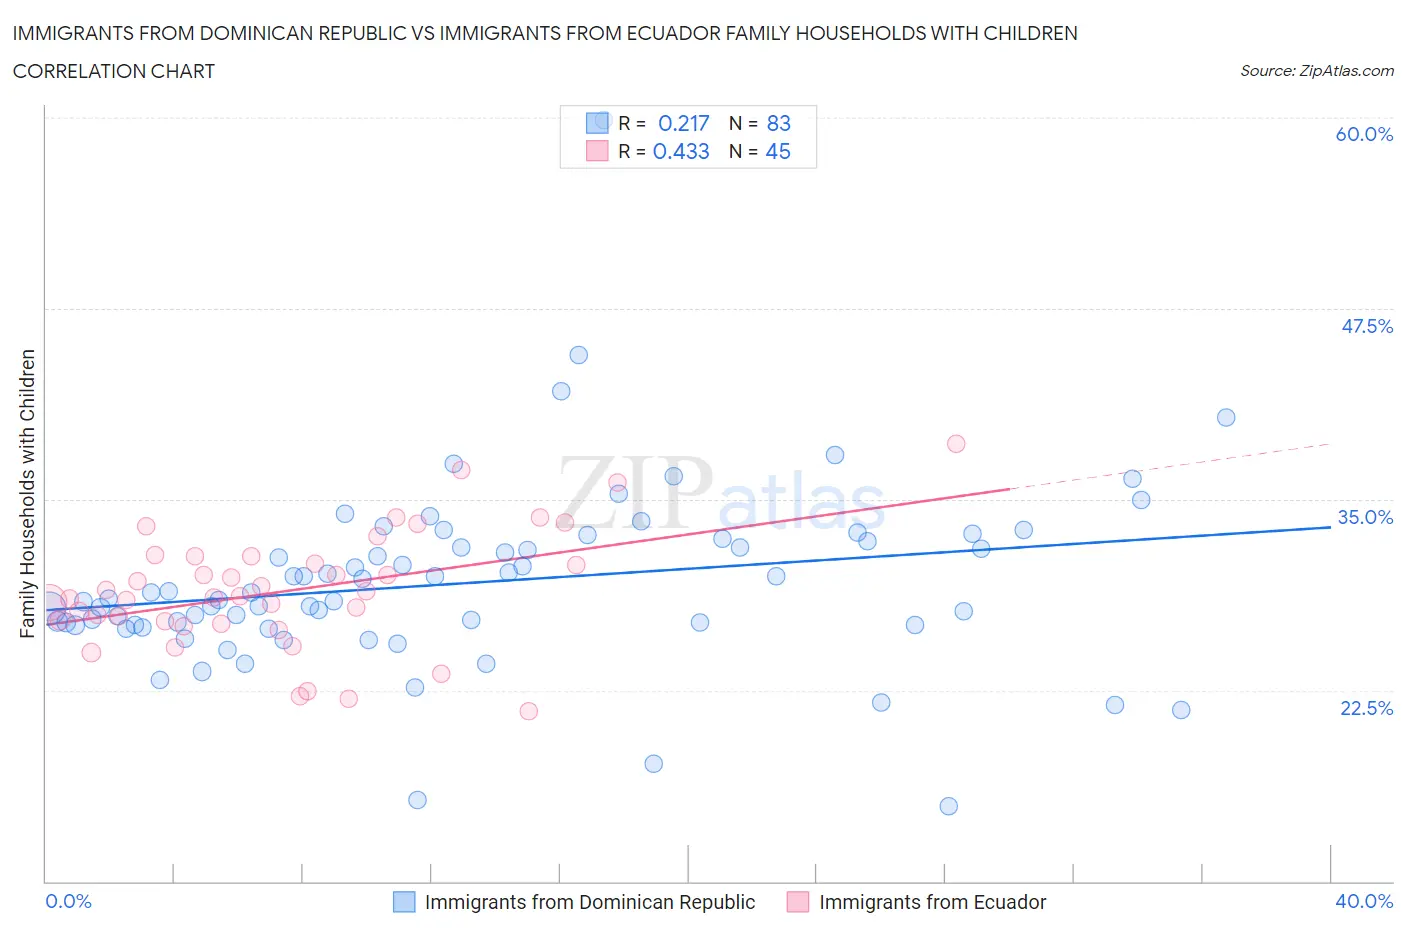
Immigrants from Dominican Republic vs Immigrants from Ecuador Family Households with Children Correlation Chart
The statistical analysis conducted on geographies consisting of 274,929,362 people shows a weak positive correlation between the proportion of Immigrants from Dominican Republic and percentage of family households with children in the United States with a correlation coefficient (R) of 0.217 and weighted average of 27.7%. Similarly, the statistical analysis conducted on geographies consisting of 270,851,545 people shows a moderate positive correlation between the proportion of Immigrants from Ecuador and percentage of family households with children in the United States with a correlation coefficient (R) of 0.433 and weighted average of 27.7%, a difference of 0.030%.
Family Households with Children Correlation Summary
| Measurement | Immigrants from Dominican Republic | Immigrants from Ecuador |
| Minimum | 14.9% | 21.1% |
| Maximum | 59.8% | 38.7% |
| Range | 44.9% | 17.5% |
| Mean | 29.5% | 29.0% |
| Median | 28.5% | 28.7% |
| Interquartile 25% (IQ1) | 26.8% | 27.0% |
| Interquartile 75% (IQ3) | 32.2% | 31.3% |
| Interquartile Range (IQR) | 5.5% | 4.3% |
| Standard Deviation (Sample) | 6.1% | 3.9% |
| Standard Deviation (Population) | 6.0% | 3.8% |
Demographics Similar to Immigrants from Dominican Republic and Immigrants from Ecuador by Family Households with Children
In terms of family households with children, the demographic groups most similar to Immigrants from Dominican Republic are Immigrants from Portugal (27.7%, a difference of 0.010%), Uruguayan (27.7%, a difference of 0.030%), Immigrants from Panama (27.7%, a difference of 0.040%), Vietnamese (27.7%, a difference of 0.050%), and Iranian (27.7%, a difference of 0.060%). Similarly, the demographic groups most similar to Immigrants from Ecuador are Immigrants from Panama (27.7%, a difference of 0.010%), Immigrants from Portugal (27.7%, a difference of 0.020%), Iranian (27.7%, a difference of 0.030%), Immigrants from Belize (27.7%, a difference of 0.050%), and Uruguayan (27.7%, a difference of 0.060%).
| Demographics | Rating | Rank | Family Households with Children |
| Immigrants | Ethiopia | 90.5 /100 | #126 | Exceptional 27.8% |
| Belizeans | 90.0 /100 | #127 | Exceptional 27.8% |
| Syrians | 89.7 /100 | #128 | Excellent 27.8% |
| Immigrants | Eritrea | 89.4 /100 | #129 | Excellent 27.8% |
| Cajuns | 87.6 /100 | #130 | Excellent 27.7% |
| Lebanese | 87.4 /100 | #131 | Excellent 27.7% |
| Immigrants | Belize | 85.7 /100 | #132 | Excellent 27.7% |
| Iranians | 85.2 /100 | #133 | Excellent 27.7% |
| Immigrants | Panama | 84.9 /100 | #134 | Excellent 27.7% |
| Immigrants | Ecuador | 84.6 /100 | #135 | Excellent 27.7% |
| Immigrants | Portugal | 84.1 /100 | #136 | Excellent 27.7% |
| Immigrants | Dominican Republic | 83.9 /100 | #137 | Excellent 27.7% |
| Uruguayans | 83.2 /100 | #138 | Excellent 27.7% |
| Vietnamese | 82.6 /100 | #139 | Excellent 27.7% |
| Spanish | 81.8 /100 | #140 | Excellent 27.7% |
| Immigrants | Eastern Asia | 81.7 /100 | #141 | Excellent 27.7% |
| Swiss | 81.4 /100 | #142 | Excellent 27.7% |
| Immigrants | Eastern Africa | 80.2 /100 | #143 | Excellent 27.7% |
| Brazilians | 79.6 /100 | #144 | Good 27.7% |
| Immigrants | Chile | 79.5 /100 | #145 | Good 27.7% |
| Basques | 79.5 /100 | #146 | Good 27.7% |