Japanese vs Ottawa Births to Unmarried Women
COMPARE
Japanese
Ottawa
Births to Unmarried Women
Births to Unmarried Women Comparison
Japanese
Ottawa
35.2%
BIRTHS TO UNMARRIED WOMEN
0.9/ 100
METRIC RATING
243rd/ 347
METRIC RANK
36.5%
BIRTHS TO UNMARRIED WOMEN
0.2/ 100
METRIC RATING
260th/ 347
METRIC RANK
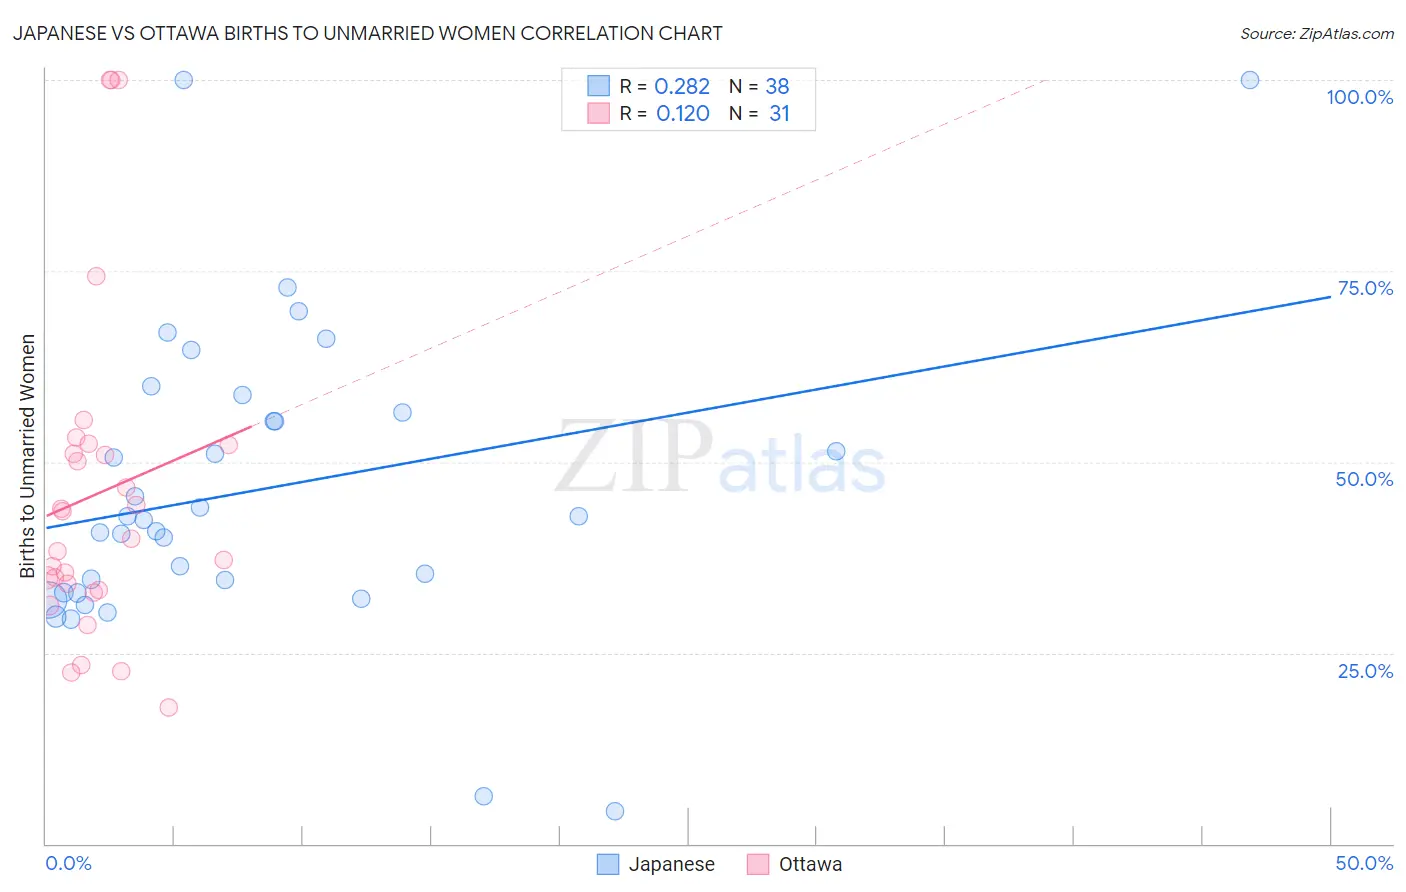
Japanese vs Ottawa Births to Unmarried Women Correlation Chart
The statistical analysis conducted on geographies consisting of 240,312,984 people shows a weak positive correlation between the proportion of Japanese and percentage of births to unmarried women in the United States with a correlation coefficient (R) of 0.282 and weighted average of 35.2%. Similarly, the statistical analysis conducted on geographies consisting of 48,969,239 people shows a poor positive correlation between the proportion of Ottawa and percentage of births to unmarried women in the United States with a correlation coefficient (R) of 0.120 and weighted average of 36.5%, a difference of 3.7%.
Births to Unmarried Women Correlation Summary
| Measurement | Japanese | Ottawa |
| Minimum | 4.3% | 17.9% |
| Maximum | 100.0% | 100.0% |
| Range | 95.7% | 82.1% |
| Mean | 46.3% | 45.9% |
| Median | 42.6% | 40.0% |
| Interquartile 25% (IQ1) | 32.9% | 33.3% |
| Interquartile 75% (IQ3) | 56.4% | 52.2% |
| Interquartile Range (IQR) | 23.5% | 18.9% |
| Standard Deviation (Sample) | 19.9% | 21.5% |
| Standard Deviation (Population) | 19.7% | 21.2% |
Demographics Similar to Japanese and Ottawa by Births to Unmarried Women
In terms of births to unmarried women, the demographic groups most similar to Japanese are Guyanese (35.2%, a difference of 0.060%), Shoshone (35.3%, a difference of 0.40%), Indonesian (35.0%, a difference of 0.49%), Nigerian (35.3%, a difference of 0.51%), and Immigrants from Guyana (35.0%, a difference of 0.59%). Similarly, the demographic groups most similar to Ottawa are Trinidadian and Tobagonian (36.5%, a difference of 0.0%), Immigrants from El Salvador (36.4%, a difference of 0.12%), American (36.4%, a difference of 0.16%), Immigrants from Grenada (36.3%, a difference of 0.45%), and Immigrants from Trinidad and Tobago (36.3%, a difference of 0.47%).
| Demographics | Rating | Rank | Births to Unmarried Women |
| Immigrants | Guyana | 1.2 /100 | #241 | Tragic 35.0% |
| Indonesians | 1.2 /100 | #242 | Tragic 35.0% |
| Japanese | 0.9 /100 | #243 | Tragic 35.2% |
| Guyanese | 0.9 /100 | #244 | Tragic 35.2% |
| Shoshone | 0.8 /100 | #245 | Tragic 35.3% |
| Nigerians | 0.7 /100 | #246 | Tragic 35.3% |
| Immigrants | Nigeria | 0.7 /100 | #247 | Tragic 35.4% |
| Immigrants | Nonimmigrants | 0.6 /100 | #248 | Tragic 35.5% |
| Bermudans | 0.6 /100 | #249 | Tragic 35.5% |
| Mexican American Indians | 0.4 /100 | #250 | Tragic 35.7% |
| Immigrants | Western Africa | 0.3 /100 | #251 | Tragic 36.0% |
| Salvadorans | 0.3 /100 | #252 | Tragic 36.0% |
| Immigrants | Portugal | 0.2 /100 | #253 | Tragic 36.2% |
| Potawatomi | 0.2 /100 | #254 | Tragic 36.2% |
| Chickasaw | 0.2 /100 | #255 | Tragic 36.3% |
| Immigrants | Trinidad and Tobago | 0.2 /100 | #256 | Tragic 36.3% |
| Immigrants | Grenada | 0.2 /100 | #257 | Tragic 36.3% |
| Americans | 0.2 /100 | #258 | Tragic 36.4% |
| Immigrants | El Salvador | 0.2 /100 | #259 | Tragic 36.4% |
| Ottawa | 0.2 /100 | #260 | Tragic 36.5% |
| Trinidadians and Tobagonians | 0.2 /100 | #261 | Tragic 36.5% |