Japanese vs Immigrants from Bosnia and Herzegovina Family Households with Children

COMPARE

Japanese
Race
Ancestry
AfghanAfricanAlaska NativeAlaskan AthabascanAlbanianAleutAlsatianAmericanApacheArabArapahoArgentineanArmenianAssyrian/Chaldean/SyriacAustralianAustrianBahamianBangladeshiBarbadianBasqueBelgianBelizeanBermudanBhutaneseBlackfeetBolivianBrazilianBritishBritish West IndianBulgarianBurmeseCajunCambodianCanadianCape VerdeanCarpatho RusynCelticCentral AmericanCentral American IndianCherokeeCheyenneChickasawChileanChineseChippewaChoctawColombianColvilleComancheCosta RicanCreeCreekCroatianCrowCubanCypriotCzechCzechoslovakianDanishDelawareDominicanDutchDutch West IndianEastern EuropeanEcuadorianEgyptianEnglishEstonianEthiopianEuropeanFijianFilipinoFinnishFrenchFrench American IndianFrench CanadianGermanGerman RussianGhanaianGreekGuamanian/ChamorroGuatemalanGuyaneseHaitianHmongHonduranHopiHoumaHungarianIcelanderIndian (Asian)IndonesianInupiatIranianIraqiIrishIroquoisIsraeliItalianJamaicanJapaneseJordanianKenyanKiowaKoreanLaotianLatvianLebaneseLiberianLithuanianLumbeeLuxembourgerMacedonianMalaysianMalteseMarshalleseMenomineeMexicanMexican American IndianMongolianMoroccanNative HawaiianNavajoNepaleseNew ZealanderNicaraguanNigerianNorthern EuropeanNorwegianOkinawanOsageOttawaPaiutePakistaniPalestinianPanamanianParaguayanPennsylvania GermanPeruvianPimaPolishPortuguesePotawatomiPuebloPuerto RicanPuget Sound SalishRomanianRussianSalvadoranSamoanScandinavianScotch-IrishScottishSeminoleSenegaleseSerbianShoshoneSierra LeoneanSiouxSlavicSlovakSloveneSomaliSouth AfricanSouth AmericanSouth American IndianSoviet UnionSpaniardSpanishSpanish AmericanSpanish American IndianSri LankanSubsaharan AfricanSudaneseSwedishSwissSyrianTaiwaneseThaiTlingit-HaidaTohono O'OdhamTonganTrinidadian and TobagonianTsimshianTurkishU.S. Virgin IslanderUgandanUkrainianUruguayanUteVenezuelanVietnameseWelshWest IndianYakamaYaquiYugoslavianYumanYup'ikZimbabwean
Immigration
NonimmigrantsImmigrantsAfghanistanAfricaAlbaniaArgentinaArmeniaAsiaAustraliaAustriaBahamasBangladeshBarbadosBelarusBelgiumBelizeBoliviaBrazilBulgariaBurma/MyanmarCabo VerdeCambodiaCameroonCanadaCaribbeanCentral AmericaChileChinaColombiaCongoCosta RicaCroatiaCubaCzechoslovakiaDenmarkDominicaDominican RepublicEastern AfricaEastern AsiaEastern EuropeEcuadorEgyptEl SalvadorEnglandEritreaEthiopiaEuropeFijiFranceGermanyGhanaGreeceGrenadaGuatemalaGuyanaHaitiHondurasHong KongHungaryIndiaIndonesiaIranIraqIrelandIsraelItalyJamaicaJapanJordanKazakhstanKenyaKoreaKuwaitLaosLatin AmericaLatviaLebanonLiberiaLithuaniaMalaysiaMexicoMicronesiaMiddle AfricaMoldovaMoroccoNepalNetherlandsNicaraguaNigeriaNorth AmericaNorth MacedoniaNorthern AfricaNorthern EuropeNorwayOceaniaPakistanPanamaPeruPhilippinesPolandPortugalRomaniaRussiaSaudi ArabiaScotlandSenegalSerbiaSierra LeoneSingaporeSomaliaSouth AfricaSouth AmericaSouth Central AsiaSouth Eastern AsiaSouthern EuropeSpainSri LankaSt. Vincent and the GrenadinesSudanSwedenSwitzerlandSyriaTaiwanThailandTrinidad and TobagoTurkeyUgandaUkraineUruguayUzbekistanVenezuelaVietnamWest IndiesWestern AfricaWestern AsiaWestern EuropeYemenZaireZimbabweAzores
Immigrants from Bosnia and Herzegovina
Race
Ancestry
AfghanAfricanAlaska NativeAlaskan AthabascanAlbanianAleutAlsatianAmericanApacheArabArapahoArgentineanArmenianAssyrian/Chaldean/SyriacAustralianAustrianBahamianBangladeshiBarbadianBasqueBelgianBelizeanBermudanBhutaneseBlackfeetBolivianBrazilianBritishBritish West IndianBulgarianBurmeseCajunCambodianCanadianCape VerdeanCarpatho RusynCelticCentral AmericanCentral American IndianCherokeeCheyenneChickasawChileanChineseChippewaChoctawColombianColvilleComancheCosta RicanCreeCreekCroatianCrowCubanCypriotCzechCzechoslovakianDanishDelawareDominicanDutchDutch West IndianEastern EuropeanEcuadorianEgyptianEnglishEstonianEthiopianEuropeanFijianFilipinoFinnishFrenchFrench American IndianFrench CanadianGermanGerman RussianGhanaianGreekGuamanian/ChamorroGuatemalanGuyaneseHaitianHmongHonduranHopiHoumaHungarianIcelanderIndian (Asian)IndonesianInupiatIranianIraqiIrishIroquoisIsraeliItalianJamaicanJordanianKenyanKiowaKoreanLaotianLatvianLebaneseLiberianLithuanianLumbeeLuxembourgerMacedonianMalaysianMalteseMarshalleseMenomineeMexicanMexican American IndianMongolianMoroccanNative HawaiianNavajoNepaleseNew ZealanderNicaraguanNigerianNorthern EuropeanNorwegianOkinawanOsageOttawaPaiutePakistaniPalestinianPanamanianParaguayanPennsylvania GermanPeruvianPimaPolishPortuguesePotawatomiPuebloPuerto RicanPuget Sound SalishRomanianRussianSalvadoranSamoanScandinavianScotch-IrishScottishSeminoleSenegaleseSerbianShoshoneSierra LeoneanSiouxSlavicSlovakSloveneSomaliSouth AfricanSouth AmericanSouth American IndianSoviet UnionSpaniardSpanishSpanish AmericanSpanish American IndianSri LankanSubsaharan AfricanSudaneseSwedishSwissSyrianTaiwaneseThaiTlingit-HaidaTohono O'OdhamTonganTrinidadian and TobagonianTsimshianTurkishU.S. Virgin IslanderUgandanUkrainianUruguayanUteVenezuelanVietnameseWelshWest IndianYakamaYaquiYugoslavianYumanYup'ikZimbabwean
Immigration
NonimmigrantsImmigrantsAfghanistanAfricaAlbaniaArgentinaArmeniaAsiaAustraliaAustriaBahamasBangladeshBarbadosBelarusBelgiumBelizeBoliviaBosnia and HerzegovinaBrazilBulgariaBurma/MyanmarCabo VerdeCambodiaCameroonCanadaCaribbeanCentral AmericaChileChinaColombiaCongoCosta RicaCroatiaCubaCzechoslovakiaDenmarkDominicaDominican RepublicEastern AfricaEastern AsiaEastern EuropeEcuadorEgyptEl SalvadorEnglandEritreaEthiopiaEuropeFijiFranceGermanyGhanaGreeceGrenadaGuatemalaGuyanaHaitiHondurasHong KongHungaryIndiaIndonesiaIranIraqIrelandIsraelItalyJamaicaJapanJordanKazakhstanKenyaKoreaKuwaitLaosLatin AmericaLatviaLebanonLiberiaLithuaniaMalaysiaMexicoMicronesiaMiddle AfricaMoldovaMoroccoNepalNetherlandsNicaraguaNigeriaNorth AmericaNorth MacedoniaNorthern AfricaNorthern EuropeNorwayOceaniaPakistanPanamaPeruPhilippinesPolandPortugalRomaniaRussiaSaudi ArabiaScotlandSenegalSerbiaSierra LeoneSingaporeSomaliaSouth AfricaSouth AmericaSouth Central AsiaSouth Eastern AsiaSouthern EuropeSpainSri LankaSt. Vincent and the GrenadinesSudanSwedenSwitzerlandSyriaTaiwanThailandTrinidad and TobagoTurkeyUgandaUkraineUruguayUzbekistanVenezuelaVietnamWest IndiesWestern AfricaWestern AsiaWestern EuropeYemenZaireZimbabweAzores
Family Households with Children
Income
Poverty
Unemployment
Labor Participation
Family Structure
Vehicle Availability
Education Level
Disability

Family Households with Children Comparison

Japanese

Immigrants from Bosnia and Herzegovina

Exceptional
Tragic
29.4%
FAMILY HOUSEHOLDS WITH CHILDREN
100.0/ 100
METRIC RATING
31st/ 347
METRIC RANK
26.8%
FAMILY HOUSEHOLDS WITH CHILDREN
1.9/ 100
METRIC RATING
251st/ 347
METRIC RANK

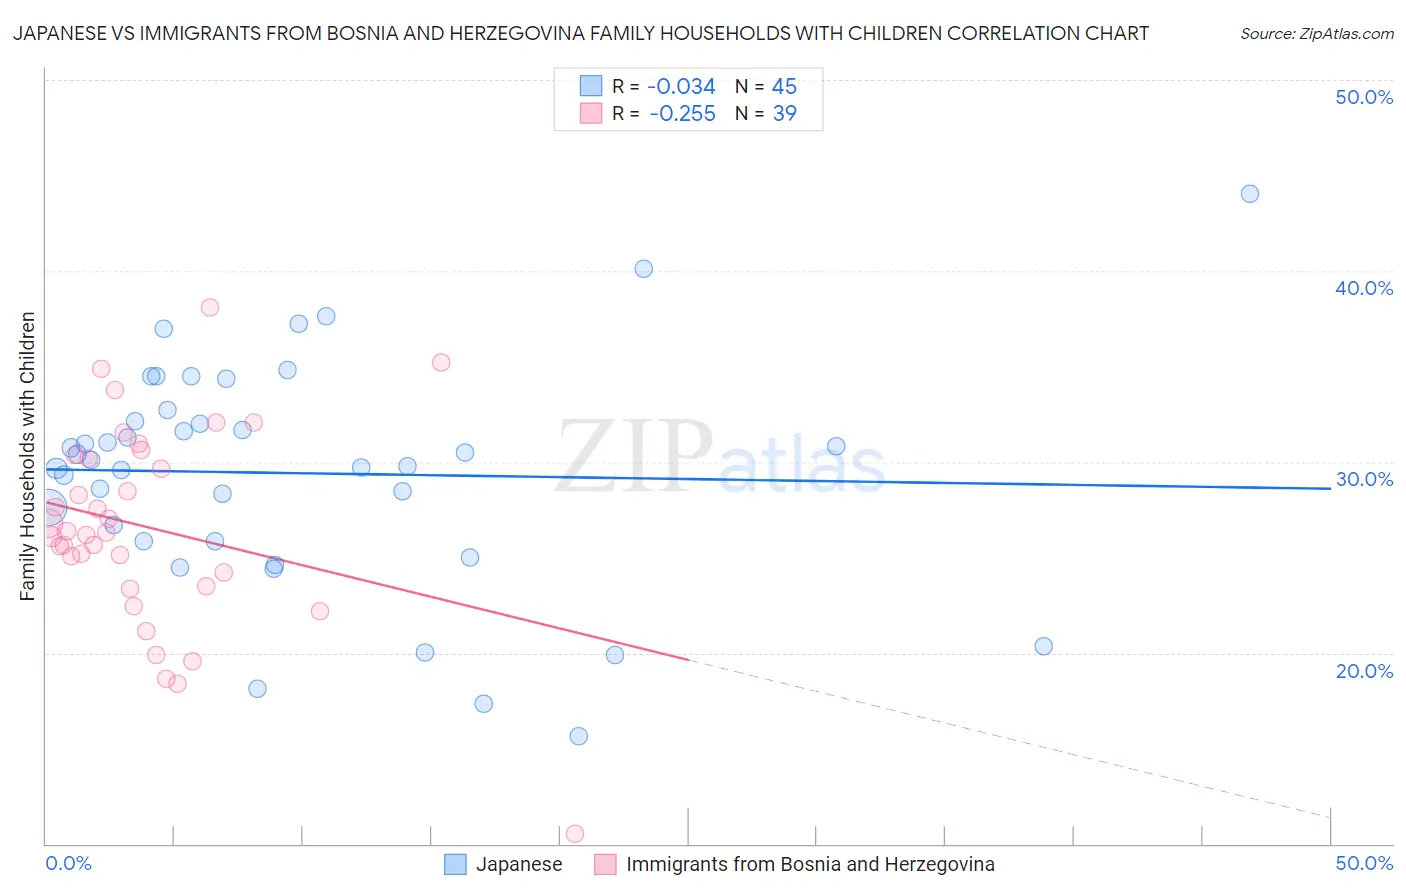
Japanese vs Immigrants from Bosnia and Herzegovina Family Households with Children Correlation Chart

The statistical analysis conducted on geographies consisting of 249,052,059 people shows no correlation between the proportion of Japanese and percentage of family households with children in the United States with a correlation coefficient (R) of -0.034 and weighted average of 29.4%. Similarly, the statistical analysis conducted on geographies consisting of 156,805,272 people shows a weak negative correlation between the proportion of Immigrants from Bosnia and Herzegovina and percentage of family households with children in the United States with a correlation coefficient (R) of -0.255 and weighted average of 26.8%, a difference of 9.7%.
Japanese vs Immigrants from Bosnia and Herzegovina Family Households with Children

Family Households with Children Correlation Summary

MeasurementJapaneseImmigrants from Bosnia and Herzegovina
Minimum15.6%10.5%
Maximum44.0%38.1%
Range28.4%27.6%
Mean29.4%26.6%
Median30.1%26.3%
Interquartile 25% (IQ1)25.8%23.5%
Interquartile 75% (IQ3)32.4%30.4%
Interquartile Range (IQR)6.6%6.9%
Standard Deviation (Sample)5.9%5.3%
Standard Deviation (Population)5.9%5.3%

Similar Demographics by Family Households with Children

Demographics Similar to Japanese by Family Households with Children

In terms of family households with children, the demographic groups most similar to Japanese are Immigrants from Yemen (29.4%, a difference of 0.060%), Yuman (29.5%, a difference of 0.14%), Samoan (29.5%, a difference of 0.18%), Bolivian (29.5%, a difference of 0.18%), and Venezuelan (29.4%, a difference of 0.26%).
DemographicsRating | RankFamily Households with Children
Guamanians/Chamorros
100.0
/100
|
#24
Exceptional
29.7%
Immigrants | Latin America
100.0
/100
|
#25
Exceptional
29.7%
Sri Lankans
100.0
/100
|
#26
Exceptional
29.5%
Immigrants | Vietnam
100.0
/100
|
#27
Exceptional
29.5%
Samoans
100.0
/100
|
#28
Exceptional
29.5%
Bolivians
100.0
/100
|
#29
Exceptional
29.5%
Yuman
100.0
/100
|
#30
Exceptional
29.5%
Japanese
100.0
/100
|
#31
Exceptional
29.4%
Immigrants | Yemen
100.0
/100
|
#32
Exceptional
29.4%
Venezuelans
100.0
/100
|
#33
Exceptional
29.4%
Immigrants | Bolivia
100.0
/100
|
#34
Exceptional
29.3%
Immigrants | Sierra Leone
100.0
/100
|
#35
Exceptional
29.3%
Immigrants | Venezuela
100.0
/100
|
#36
Exceptional
29.3%
Immigrants | Cameroon
100.0
/100
|
#37
Exceptional
29.2%
Koreans
100.0
/100
|
#38
Exceptional
29.2%

Demographics Similar to Immigrants from Bosnia and Herzegovina by Family Households with Children

In terms of family households with children, the demographic groups most similar to Immigrants from Bosnia and Herzegovina are Irish (26.8%, a difference of 0.030%), Belgian (26.9%, a difference of 0.060%), Immigrants from Eastern Europe (26.9%, a difference of 0.070%), Immigrants from Kazakhstan (26.9%, a difference of 0.080%), and Potawatomi (26.9%, a difference of 0.090%).
DemographicsRating | RankFamily Households with Children
Ukrainians
2.9
/100
|
#244
Tragic
26.9%
Australians
2.8
/100
|
#245
Tragic
26.9%
Jamaicans
2.5
/100
|
#246
Tragic
26.9%
Potawatomi
2.2
/100
|
#247
Tragic
26.9%
Immigrants | Kazakhstan
2.2
/100
|
#248
Tragic
26.9%
Immigrants | Eastern Europe
2.1
/100
|
#249
Tragic
26.9%
Belgians
2.1
/100
|
#250
Tragic
26.9%
Immigrants | Bosnia and Herzegovina
1.9
/100
|
#251
Tragic
26.8%
Irish
1.8
/100
|
#252
Tragic
26.8%
Italians
1.5
/100
|
#253
Tragic
26.8%
Immigrants | Scotland
1.5
/100
|
#254
Tragic
26.8%
German Russians
1.5
/100
|
#255
Tragic
26.8%
Scotch-Irish
1.4
/100
|
#256
Tragic
26.8%
Slavs
1.3
/100
|
#257
Tragic
26.8%
Immigrants | Cuba
1.3
/100
|
#258
Tragic
26.8%