Immigrants from South Eastern Asia vs Icelander Family Households with Children
COMPARE
Immigrants from South Eastern Asia
Icelander
Family Households with Children
Family Households with Children Comparison
Immigrants from South Eastern Asia
Icelanders
29.1%
FAMILY HOUSEHOLDS WITH CHILDREN
100.0/ 100
METRIC RATING
41st/ 347
METRIC RANK
27.6%
FAMILY HOUSEHOLDS WITH CHILDREN
75.3/ 100
METRIC RATING
154th/ 347
METRIC RANK
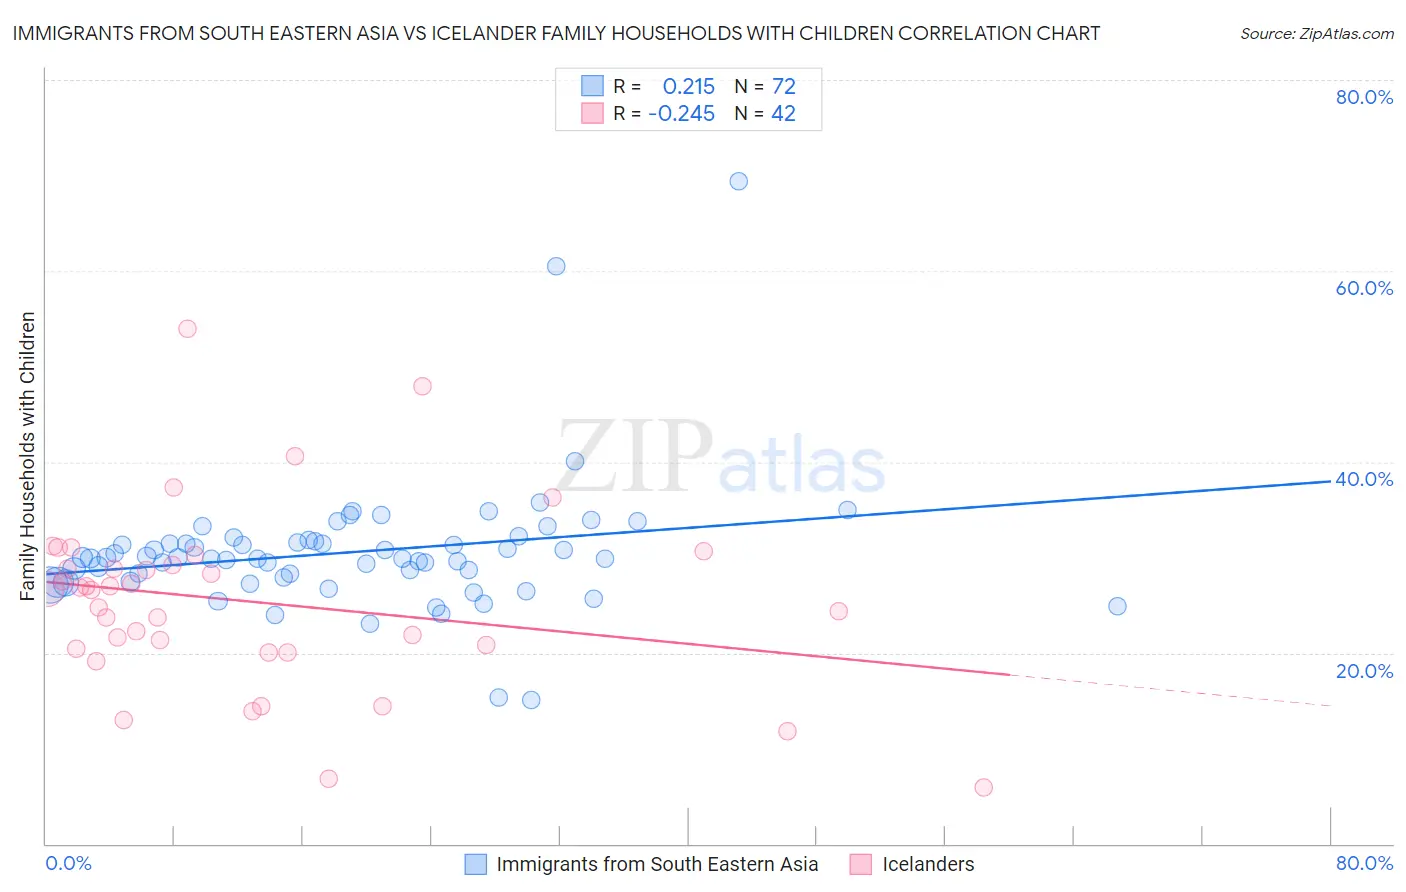
Immigrants from South Eastern Asia vs Icelander Family Households with Children Correlation Chart
The statistical analysis conducted on geographies consisting of 512,001,963 people shows a weak positive correlation between the proportion of Immigrants from South Eastern Asia and percentage of family households with children in the United States with a correlation coefficient (R) of 0.215 and weighted average of 29.1%. Similarly, the statistical analysis conducted on geographies consisting of 159,563,345 people shows a weak negative correlation between the proportion of Icelanders and percentage of family households with children in the United States with a correlation coefficient (R) of -0.245 and weighted average of 27.6%, a difference of 5.4%.
Family Households with Children Correlation Summary
| Measurement | Immigrants from South Eastern Asia | Icelander |
| Minimum | 15.0% | 5.9% |
| Maximum | 69.4% | 53.9% |
| Range | 54.4% | 48.1% |
| Mean | 30.5% | 25.4% |
| Median | 29.9% | 26.7% |
| Interquartile 25% (IQ1) | 27.7% | 20.4% |
| Interquartile 75% (IQ3) | 31.6% | 29.1% |
| Interquartile Range (IQR) | 3.9% | 8.7% |
| Standard Deviation (Sample) | 7.1% | 9.5% |
| Standard Deviation (Population) | 7.0% | 9.4% |
Similar Demographics by Family Households with Children
Demographics Similar to Immigrants from South Eastern Asia by Family Households with Children
In terms of family households with children, the demographic groups most similar to Immigrants from South Eastern Asia are Spanish American Indian (29.1%, a difference of 0.0%), Central American (29.1%, a difference of 0.090%), Yaqui (29.1%, a difference of 0.10%), Asian (29.1%, a difference of 0.19%), and Immigrants from Taiwan (29.0%, a difference of 0.23%).
| Demographics | Rating | Rank | Family Households with Children |
| Immigrants | Bolivia | 100.0 /100 | #34 | Exceptional 29.3% |
| Immigrants | Sierra Leone | 100.0 /100 | #35 | Exceptional 29.3% |
| Immigrants | Venezuela | 100.0 /100 | #36 | Exceptional 29.3% |
| Immigrants | Cameroon | 100.0 /100 | #37 | Exceptional 29.2% |
| Koreans | 100.0 /100 | #38 | Exceptional 29.2% |
| Yaqui | 100.0 /100 | #39 | Exceptional 29.1% |
| Central Americans | 100.0 /100 | #40 | Exceptional 29.1% |
| Immigrants | South Eastern Asia | 100.0 /100 | #41 | Exceptional 29.1% |
| Spanish American Indians | 100.0 /100 | #42 | Exceptional 29.1% |
| Asians | 100.0 /100 | #43 | Exceptional 29.1% |
| Immigrants | Taiwan | 100.0 /100 | #44 | Exceptional 29.0% |
| Fijians | 100.0 /100 | #45 | Exceptional 29.0% |
| Immigrants | Philippines | 100.0 /100 | #46 | Exceptional 29.0% |
| Peruvians | 100.0 /100 | #47 | Exceptional 29.0% |
| Apache | 100.0 /100 | #48 | Exceptional 29.0% |
Demographics Similar to Icelanders by Family Households with Children
In terms of family households with children, the demographic groups most similar to Icelanders are Immigrants from Cabo Verde (27.6%, a difference of 0.010%), Comanche (27.6%, a difference of 0.010%), Hungarian (27.6%, a difference of 0.020%), Ethiopian (27.6%, a difference of 0.050%), and Portuguese (27.6%, a difference of 0.080%).
| Demographics | Rating | Rank | Family Households with Children |
| Immigrants | Moldova | 79.1 /100 | #147 | Good 27.6% |
| Osage | 79.0 /100 | #148 | Good 27.6% |
| Menominee | 78.9 /100 | #149 | Good 27.6% |
| Argentineans | 78.5 /100 | #150 | Good 27.6% |
| Portuguese | 77.8 /100 | #151 | Good 27.6% |
| Ethiopians | 77.0 /100 | #152 | Good 27.6% |
| Immigrants | Cabo Verde | 75.6 /100 | #153 | Good 27.6% |
| Icelanders | 75.3 /100 | #154 | Good 27.6% |
| Comanche | 74.8 /100 | #155 | Good 27.6% |
| Hungarians | 74.6 /100 | #156 | Good 27.6% |
| Indians (Asian) | 71.6 /100 | #157 | Good 27.6% |
| Romanians | 70.8 /100 | #158 | Good 27.6% |
| Mongolians | 70.7 /100 | #159 | Good 27.6% |
| Sub-Saharan Africans | 67.5 /100 | #160 | Good 27.6% |
| Alaskan Athabascans | 67.1 /100 | #161 | Good 27.6% |