Ukrainian vs Spaniard Single Mother Households
COMPARE
Ukrainian
Spaniard
Single Mother Households
Single Mother Households Comparison
Ukrainians
Spaniards
5.7%
SINGLE MOTHER HOUSEHOLDS
97.2/ 100
METRIC RATING
89th/ 347
METRIC RANK
6.5%
SINGLE MOTHER HOUSEHOLDS
27.8/ 100
METRIC RATING
183rd/ 347
METRIC RANK
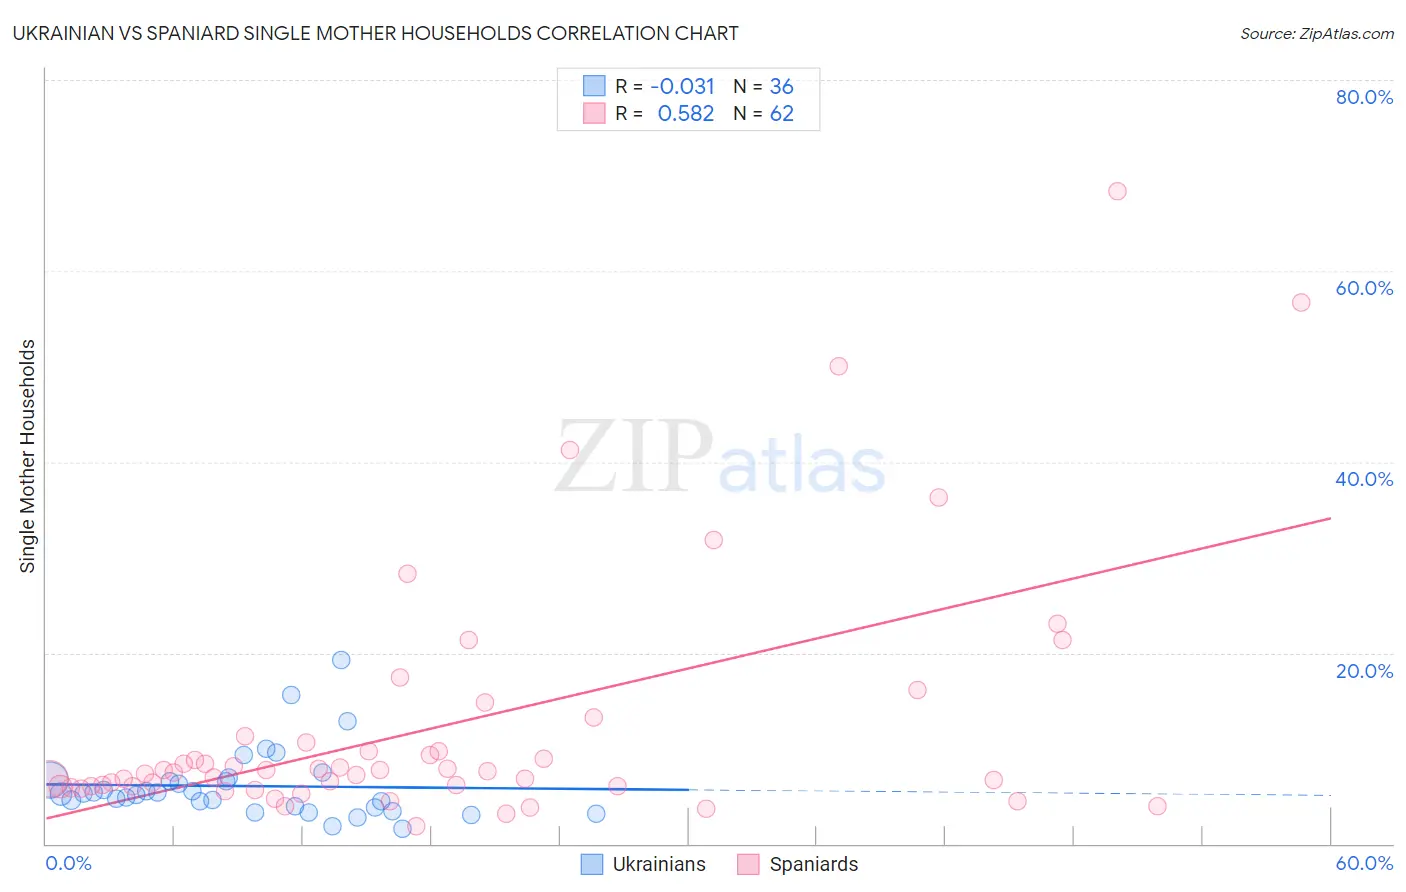
Ukrainian vs Spaniard Single Mother Households Correlation Chart
The statistical analysis conducted on geographies consisting of 446,426,156 people shows no correlation between the proportion of Ukrainians and percentage of single mother households in the United States with a correlation coefficient (R) of -0.031 and weighted average of 5.7%. Similarly, the statistical analysis conducted on geographies consisting of 441,881,486 people shows a substantial positive correlation between the proportion of Spaniards and percentage of single mother households in the United States with a correlation coefficient (R) of 0.582 and weighted average of 6.5%, a difference of 13.7%.
Single Mother Households Correlation Summary
| Measurement | Ukrainian | Spaniard |
| Minimum | 1.6% | 1.9% |
| Maximum | 19.3% | 68.3% |
| Range | 17.7% | 66.4% |
| Mean | 6.0% | 12.3% |
| Median | 5.2% | 7.5% |
| Interquartile 25% (IQ1) | 3.9% | 6.0% |
| Interquartile 75% (IQ3) | 6.6% | 10.6% |
| Interquartile Range (IQR) | 2.7% | 4.7% |
| Standard Deviation (Sample) | 3.7% | 13.2% |
| Standard Deviation (Population) | 3.6% | 13.1% |
Similar Demographics by Single Mother Households
Demographics Similar to Ukrainians by Single Mother Households
In terms of single mother households, the demographic groups most similar to Ukrainians are Immigrants from Indonesia (5.7%, a difference of 0.060%), Israeli (5.7%, a difference of 0.26%), European (5.7%, a difference of 0.28%), Immigrants from Turkey (5.7%, a difference of 0.33%), and Finnish (5.7%, a difference of 0.41%).
| Demographics | Rating | Rank | Single Mother Households |
| Immigrants | Malaysia | 97.8 /100 | #82 | Exceptional 5.7% |
| Immigrants | Hungary | 97.8 /100 | #83 | Exceptional 5.7% |
| Carpatho Rusyns | 97.7 /100 | #84 | Exceptional 5.7% |
| Hungarians | 97.6 /100 | #85 | Exceptional 5.7% |
| Finns | 97.6 /100 | #86 | Exceptional 5.7% |
| Immigrants | Turkey | 97.5 /100 | #87 | Exceptional 5.7% |
| Israelis | 97.4 /100 | #88 | Exceptional 5.7% |
| Ukrainians | 97.2 /100 | #89 | Exceptional 5.7% |
| Immigrants | Indonesia | 97.2 /100 | #90 | Exceptional 5.7% |
| Europeans | 97.0 /100 | #91 | Exceptional 5.7% |
| Immigrants | Western Asia | 96.7 /100 | #92 | Exceptional 5.7% |
| Serbians | 96.7 /100 | #93 | Exceptional 5.7% |
| Basques | 96.7 /100 | #94 | Exceptional 5.7% |
| Slovaks | 96.6 /100 | #95 | Exceptional 5.7% |
| Austrians | 96.4 /100 | #96 | Exceptional 5.7% |
Demographics Similar to Spaniards by Single Mother Households
In terms of single mother households, the demographic groups most similar to Spaniards are Ethiopian (6.5%, a difference of 0.24%), Ugandan (6.5%, a difference of 0.30%), Costa Rican (6.5%, a difference of 0.42%), Immigrants from Afghanistan (6.5%, a difference of 0.43%), and Ottawa (6.5%, a difference of 0.56%).
| Demographics | Rating | Rank | Single Mother Households |
| Immigrants | Bosnia and Herzegovina | 44.3 /100 | #176 | Average 6.3% |
| Osage | 43.0 /100 | #177 | Average 6.4% |
| Portuguese | 40.0 /100 | #178 | Fair 6.4% |
| Hmong | 39.8 /100 | #179 | Fair 6.4% |
| Immigrants | Nepal | 36.1 /100 | #180 | Fair 6.4% |
| Spanish | 33.4 /100 | #181 | Fair 6.4% |
| South American Indians | 33.4 /100 | #182 | Fair 6.4% |
| Spaniards | 27.8 /100 | #183 | Fair 6.5% |
| Ethiopians | 26.0 /100 | #184 | Fair 6.5% |
| Ugandans | 25.6 /100 | #185 | Fair 6.5% |
| Costa Ricans | 24.8 /100 | #186 | Fair 6.5% |
| Immigrants | Afghanistan | 24.7 /100 | #187 | Fair 6.5% |
| Ottawa | 23.8 /100 | #188 | Fair 6.5% |
| Delaware | 23.3 /100 | #189 | Fair 6.5% |
| Peruvians | 21.6 /100 | #190 | Fair 6.5% |