Immigrants from Ukraine vs Kenyan 6th Grade
COMPARE
Immigrants from Ukraine
Kenyan
6th Grade
6th Grade Comparison
Immigrants from Ukraine
Kenyans
97.0%
6TH GRADE
35.6/ 100
METRIC RATING
182nd/ 347
METRIC RANK
97.1%
6TH GRADE
62.9/ 100
METRIC RATING
159th/ 347
METRIC RANK
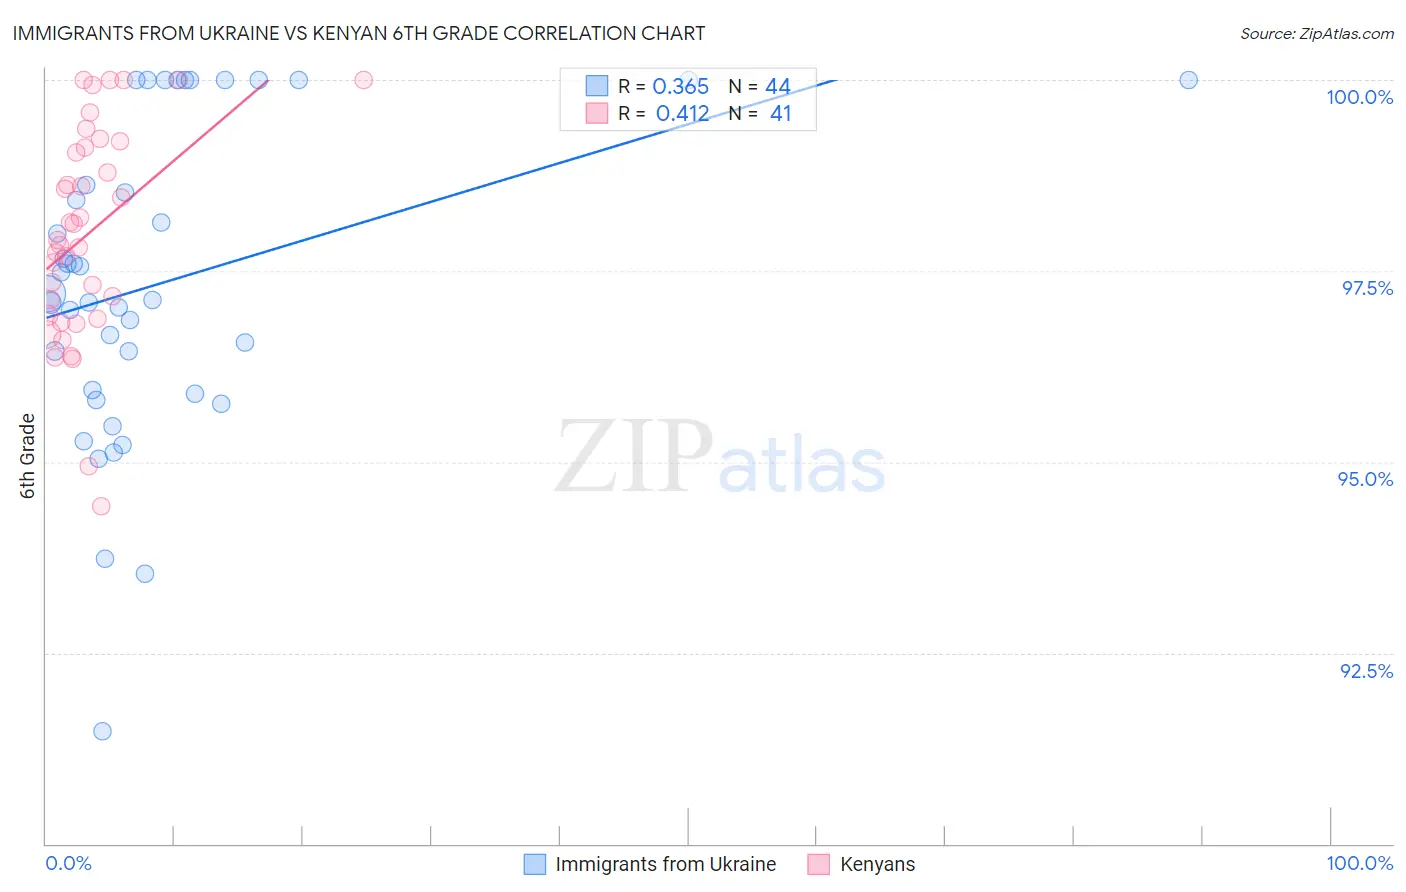
Immigrants from Ukraine vs Kenyan 6th Grade Correlation Chart
The statistical analysis conducted on geographies consisting of 289,712,791 people shows a mild positive correlation between the proportion of Immigrants from Ukraine and percentage of population with at least 6th grade education in the United States with a correlation coefficient (R) of 0.365 and weighted average of 97.0%. Similarly, the statistical analysis conducted on geographies consisting of 168,244,042 people shows a moderate positive correlation between the proportion of Kenyans and percentage of population with at least 6th grade education in the United States with a correlation coefficient (R) of 0.412 and weighted average of 97.1%, a difference of 0.13%.
6th Grade Correlation Summary
| Measurement | Immigrants from Ukraine | Kenyan |
| Minimum | 91.5% | 94.4% |
| Maximum | 100.0% | 100.0% |
| Range | 8.5% | 5.6% |
| Mean | 97.3% | 98.0% |
| Median | 97.2% | 97.9% |
| Interquartile 25% (IQ1) | 95.9% | 96.9% |
| Interquartile 75% (IQ3) | 99.3% | 99.2% |
| Interquartile Range (IQR) | 3.4% | 2.3% |
| Standard Deviation (Sample) | 2.0% | 1.4% |
| Standard Deviation (Population) | 2.0% | 1.4% |
Similar Demographics by 6th Grade
Demographics Similar to Immigrants from Ukraine by 6th Grade
In terms of 6th grade, the demographic groups most similar to Immigrants from Ukraine are Comanche (97.0%, a difference of 0.010%), Immigrants from Venezuela (97.0%, a difference of 0.010%), Spanish American (97.0%, a difference of 0.010%), Argentinean (97.0%, a difference of 0.010%), and Immigrants from Spain (97.0%, a difference of 0.020%).
| Demographics | Rating | Rank | 6th Grade |
| Immigrants | Kazakhstan | 47.3 /100 | #175 | Average 97.0% |
| Immigrants | Micronesia | 47.1 /100 | #176 | Average 97.0% |
| Mongolians | 46.7 /100 | #177 | Average 97.0% |
| Pakistanis | 46.0 /100 | #178 | Average 97.0% |
| Immigrants | Kenya | 45.3 /100 | #179 | Average 97.0% |
| Immigrants | Spain | 39.9 /100 | #180 | Fair 97.0% |
| Comanche | 37.9 /100 | #181 | Fair 97.0% |
| Immigrants | Ukraine | 35.6 /100 | #182 | Fair 97.0% |
| Immigrants | Venezuela | 34.5 /100 | #183 | Fair 97.0% |
| Spanish Americans | 33.5 /100 | #184 | Fair 97.0% |
| Argentineans | 33.0 /100 | #185 | Fair 97.0% |
| Immigrants | Egypt | 31.4 /100 | #186 | Fair 97.0% |
| Guamanians/Chamorros | 30.6 /100 | #187 | Fair 97.0% |
| Immigrants | Argentina | 30.4 /100 | #188 | Fair 97.0% |
| Blacks/African Americans | 30.2 /100 | #189 | Fair 97.0% |
Demographics Similar to Kenyans by 6th Grade
In terms of 6th grade, the demographic groups most similar to Kenyans are Immigrants from Iran (97.1%, a difference of 0.0%), Ugandan (97.1%, a difference of 0.0%), Immigrants from Belarus (97.1%, a difference of 0.010%), Marshallese (97.1%, a difference of 0.010%), and Immigrants from Russia (97.1%, a difference of 0.020%).
| Demographics | Rating | Rank | 6th Grade |
| Immigrants | Jordan | 73.0 /100 | #152 | Good 97.2% |
| Immigrants | Eastern Europe | 72.6 /100 | #153 | Good 97.2% |
| Soviet Union | 71.5 /100 | #154 | Good 97.2% |
| Ute | 71.1 /100 | #155 | Good 97.1% |
| Alsatians | 69.8 /100 | #156 | Good 97.1% |
| Immigrants | Russia | 67.6 /100 | #157 | Good 97.1% |
| Immigrants | Iran | 63.3 /100 | #158 | Good 97.1% |
| Kenyans | 62.9 /100 | #159 | Good 97.1% |
| Ugandans | 62.2 /100 | #160 | Good 97.1% |
| Immigrants | Belarus | 60.4 /100 | #161 | Good 97.1% |
| Marshallese | 60.2 /100 | #162 | Good 97.1% |
| Albanians | 57.8 /100 | #163 | Average 97.1% |
| Immigrants | Korea | 57.7 /100 | #164 | Average 97.1% |
| Immigrants | Poland | 56.2 /100 | #165 | Average 97.1% |
| Immigrants | Italy | 53.8 /100 | #166 | Average 97.1% |