Immigrants from Syria vs Serbian Divorced or Separated
COMPARE
Immigrants from Syria
Serbian
Divorced or Separated
Divorced or Separated Comparison
Immigrants from Syria
Serbians
11.4%
DIVORCED OR SEPARATED
99.7/ 100
METRIC RATING
67th/ 347
METRIC RANK
12.0%
DIVORCED OR SEPARATED
57.1/ 100
METRIC RATING
168th/ 347
METRIC RANK
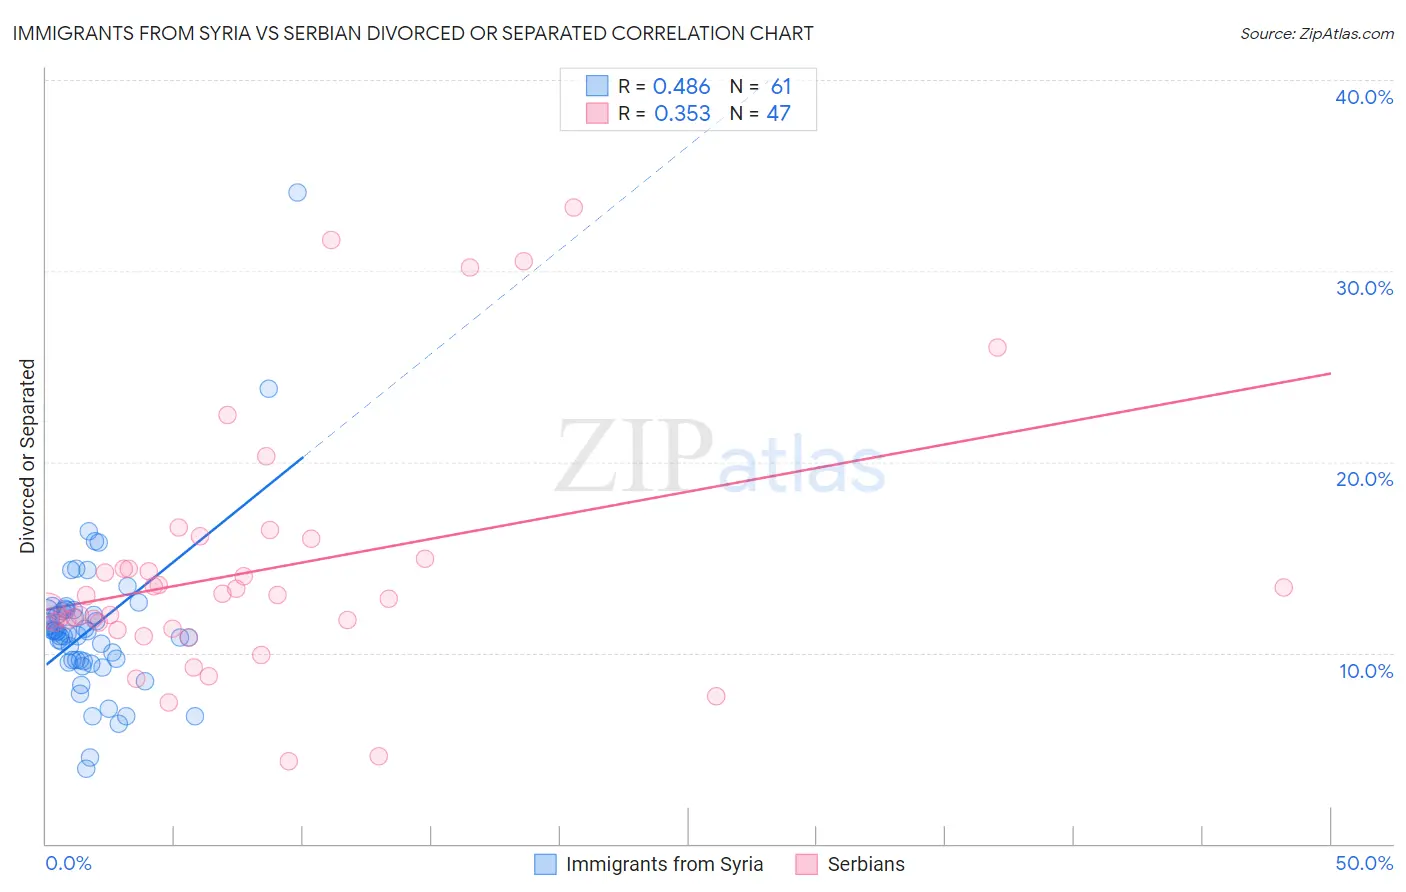
Immigrants from Syria vs Serbian Divorced or Separated Correlation Chart
The statistical analysis conducted on geographies consisting of 174,113,022 people shows a moderate positive correlation between the proportion of Immigrants from Syria and percentage of population currently divorced or separated in the United States with a correlation coefficient (R) of 0.486 and weighted average of 11.4%. Similarly, the statistical analysis conducted on geographies consisting of 267,557,430 people shows a mild positive correlation between the proportion of Serbians and percentage of population currently divorced or separated in the United States with a correlation coefficient (R) of 0.353 and weighted average of 12.0%, a difference of 5.1%.
Divorced or Separated Correlation Summary
| Measurement | Immigrants from Syria | Serbian |
| Minimum | 3.9% | 4.3% |
| Maximum | 34.1% | 33.3% |
| Range | 30.2% | 29.0% |
| Mean | 11.3% | 14.3% |
| Median | 11.1% | 13.0% |
| Interquartile 25% (IQ1) | 9.6% | 11.2% |
| Interquartile 75% (IQ3) | 12.2% | 14.9% |
| Interquartile Range (IQR) | 2.6% | 3.7% |
| Standard Deviation (Sample) | 4.2% | 6.5% |
| Standard Deviation (Population) | 4.2% | 6.4% |
Similar Demographics by Divorced or Separated
Demographics Similar to Immigrants from Syria by Divorced or Separated
In terms of divorced or separated, the demographic groups most similar to Immigrants from Syria are Inupiat (11.4%, a difference of 0.090%), Palestinian (11.5%, a difference of 0.11%), Immigrants from Belgium (11.5%, a difference of 0.11%), Immigrants from Eastern Europe (11.5%, a difference of 0.13%), and Immigrants from South Eastern Asia (11.4%, a difference of 0.23%).
| Demographics | Rating | Rank | Divorced or Separated |
| Immigrants | Russia | 99.9 /100 | #60 | Exceptional 11.3% |
| Koreans | 99.9 /100 | #61 | Exceptional 11.3% |
| Luxembourgers | 99.9 /100 | #62 | Exceptional 11.3% |
| Immigrants | Kuwait | 99.9 /100 | #63 | Exceptional 11.3% |
| Macedonians | 99.8 /100 | #64 | Exceptional 11.4% |
| Immigrants | South Eastern Asia | 99.8 /100 | #65 | Exceptional 11.4% |
| Inupiat | 99.8 /100 | #66 | Exceptional 11.4% |
| Immigrants | Syria | 99.7 /100 | #67 | Exceptional 11.4% |
| Palestinians | 99.7 /100 | #68 | Exceptional 11.5% |
| Immigrants | Belgium | 99.7 /100 | #69 | Exceptional 11.5% |
| Immigrants | Eastern Europe | 99.7 /100 | #70 | Exceptional 11.5% |
| Paraguayans | 99.7 /100 | #71 | Exceptional 11.5% |
| Jordanians | 99.6 /100 | #72 | Exceptional 11.5% |
| Immigrants | North Macedonia | 99.6 /100 | #73 | Exceptional 11.5% |
| Taiwanese | 99.6 /100 | #74 | Exceptional 11.5% |
Demographics Similar to Serbians by Divorced or Separated
In terms of divorced or separated, the demographic groups most similar to Serbians are Immigrants from Peru (12.0%, a difference of 0.0%), Mexican American Indian (12.0%, a difference of 0.040%), Ethiopian (12.0%, a difference of 0.050%), Tohono O'odham (12.0%, a difference of 0.12%), and Costa Rican (12.0%, a difference of 0.13%).
| Demographics | Rating | Rank | Divorced or Separated |
| Marshallese | 64.6 /100 | #161 | Good 12.0% |
| Samoans | 64.3 /100 | #162 | Good 12.0% |
| Navajo | 63.9 /100 | #163 | Good 12.0% |
| Swiss | 63.6 /100 | #164 | Good 12.0% |
| German Russians | 61.8 /100 | #165 | Good 12.0% |
| Tohono O'odham | 60.4 /100 | #166 | Good 12.0% |
| Ethiopians | 58.5 /100 | #167 | Average 12.0% |
| Serbians | 57.1 /100 | #168 | Average 12.0% |
| Immigrants | Peru | 57.0 /100 | #169 | Average 12.0% |
| Mexican American Indians | 55.8 /100 | #170 | Average 12.0% |
| Costa Ricans | 53.3 /100 | #171 | Average 12.0% |
| Immigrants | Mexico | 53.2 /100 | #172 | Average 12.0% |
| Immigrants | Moldova | 50.4 /100 | #173 | Average 12.1% |
| Hawaiians | 50.0 /100 | #174 | Average 12.1% |
| Immigrants | Sierra Leone | 50.0 /100 | #175 | Average 12.1% |