Immigrants from Syria vs Serbian 5th Grade
COMPARE
Immigrants from Syria
Serbian
5th Grade
5th Grade Comparison
Immigrants from Syria
Serbians
97.1%
5TH GRADE
6.4/ 100
METRIC RATING
219th/ 347
METRIC RANK
97.9%
5TH GRADE
99.7/ 100
METRIC RATING
61st/ 347
METRIC RANK
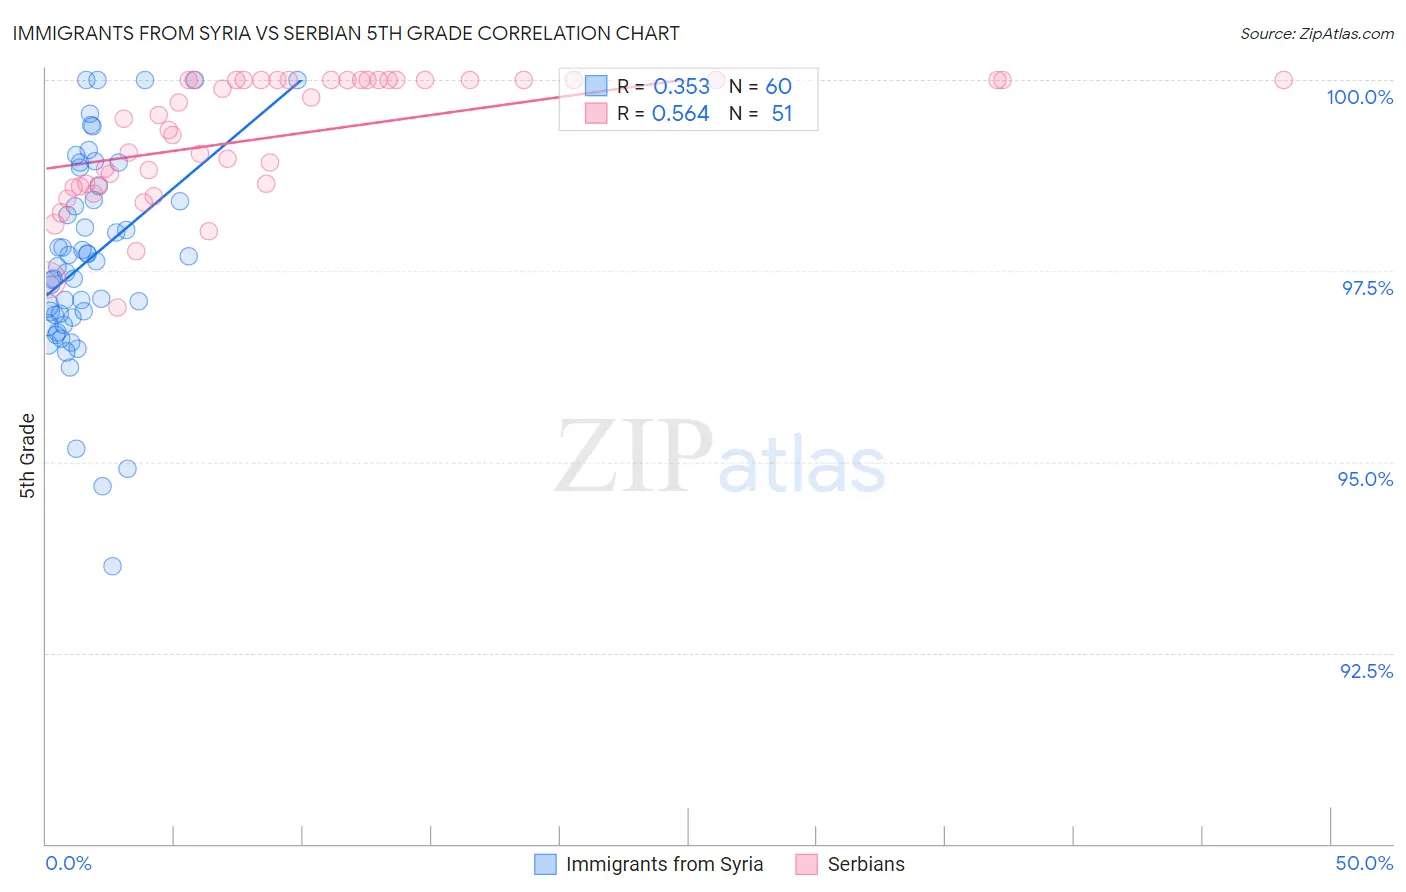
Immigrants from Syria vs Serbian 5th Grade Correlation Chart
The statistical analysis conducted on geographies consisting of 174,108,374 people shows a mild positive correlation between the proportion of Immigrants from Syria and percentage of population with at least 5th grade education in the United States with a correlation coefficient (R) of 0.353 and weighted average of 97.1%. Similarly, the statistical analysis conducted on geographies consisting of 267,642,942 people shows a substantial positive correlation between the proportion of Serbians and percentage of population with at least 5th grade education in the United States with a correlation coefficient (R) of 0.564 and weighted average of 97.9%, a difference of 0.89%.
5th Grade Correlation Summary
| Measurement | Immigrants from Syria | Serbian |
| Minimum | 93.6% | 97.0% |
| Maximum | 100.0% | 100.0% |
| Range | 6.4% | 3.0% |
| Mean | 97.7% | 99.3% |
| Median | 97.6% | 99.5% |
| Interquartile 25% (IQ1) | 96.9% | 98.6% |
| Interquartile 75% (IQ3) | 98.5% | 100.0% |
| Interquartile Range (IQR) | 1.6% | 1.4% |
| Standard Deviation (Sample) | 1.3% | 0.81% |
| Standard Deviation (Population) | 1.3% | 0.81% |
Similar Demographics by 5th Grade
Demographics Similar to Immigrants from Syria by 5th Grade
In terms of 5th grade, the demographic groups most similar to Immigrants from Syria are Immigrants from Sudan (97.1%, a difference of 0.0%), Immigrants from Southern Europe (97.1%, a difference of 0.0%), Sudanese (97.1%, a difference of 0.010%), Immigrants from Lebanon (97.1%, a difference of 0.010%), and Sierra Leonean (97.1%, a difference of 0.010%).
| Demographics | Rating | Rank | 5th Grade |
| Immigrants | Iraq | 8.3 /100 | #212 | Tragic 97.1% |
| Portuguese | 7.8 /100 | #213 | Tragic 97.1% |
| Costa Ricans | 7.7 /100 | #214 | Tragic 97.1% |
| Immigrants | Morocco | 7.5 /100 | #215 | Tragic 97.1% |
| Sudanese | 7.0 /100 | #216 | Tragic 97.1% |
| Immigrants | Lebanon | 6.8 /100 | #217 | Tragic 97.1% |
| Immigrants | Sudan | 6.5 /100 | #218 | Tragic 97.1% |
| Immigrants | Syria | 6.4 /100 | #219 | Tragic 97.1% |
| Immigrants | Southern Europe | 6.3 /100 | #220 | Tragic 97.1% |
| Sierra Leoneans | 6.0 /100 | #221 | Tragic 97.1% |
| Immigrants | Panama | 5.7 /100 | #222 | Tragic 97.0% |
| Liberians | 5.7 /100 | #223 | Tragic 97.0% |
| South American Indians | 5.4 /100 | #224 | Tragic 97.0% |
| Bahamians | 5.3 /100 | #225 | Tragic 97.0% |
| Tongans | 5.3 /100 | #226 | Tragic 97.0% |
Demographics Similar to Serbians by 5th Grade
In terms of 5th grade, the demographic groups most similar to Serbians are Immigrants from North America (97.9%, a difference of 0.0%), Immigrants from Canada (97.9%, a difference of 0.010%), Russian (97.9%, a difference of 0.010%), American (97.9%, a difference of 0.020%), and Immigrants from Northern Europe (97.9%, a difference of 0.020%).
| Demographics | Rating | Rank | 5th Grade |
| Australians | 99.8 /100 | #54 | Exceptional 98.0% |
| Creek | 99.8 /100 | #55 | Exceptional 98.0% |
| Greeks | 99.8 /100 | #56 | Exceptional 97.9% |
| Austrians | 99.8 /100 | #57 | Exceptional 97.9% |
| Whites/Caucasians | 99.8 /100 | #58 | Exceptional 97.9% |
| Americans | 99.7 /100 | #59 | Exceptional 97.9% |
| Immigrants | Canada | 99.7 /100 | #60 | Exceptional 97.9% |
| Serbians | 99.7 /100 | #61 | Exceptional 97.9% |
| Immigrants | North America | 99.7 /100 | #62 | Exceptional 97.9% |
| Russians | 99.7 /100 | #63 | Exceptional 97.9% |
| Immigrants | Northern Europe | 99.6 /100 | #64 | Exceptional 97.9% |
| Canadians | 99.6 /100 | #65 | Exceptional 97.9% |
| Immigrants | Austria | 99.6 /100 | #66 | Exceptional 97.9% |
| New Zealanders | 99.6 /100 | #67 | Exceptional 97.9% |
| Cajuns | 99.6 /100 | #68 | Exceptional 97.9% |