Arapaho vs Iroquois Family Households with Children
COMPARE
Arapaho
Iroquois
Family Households with Children
Family Households with Children Comparison
Arapaho
Iroquois
25.6%
FAMILY HOUSEHOLDS WITH CHILDREN
0.0/ 100
METRIC RATING
338th/ 347
METRIC RANK
26.1%
FAMILY HOUSEHOLDS WITH CHILDREN
0.0/ 100
METRIC RATING
318th/ 347
METRIC RANK
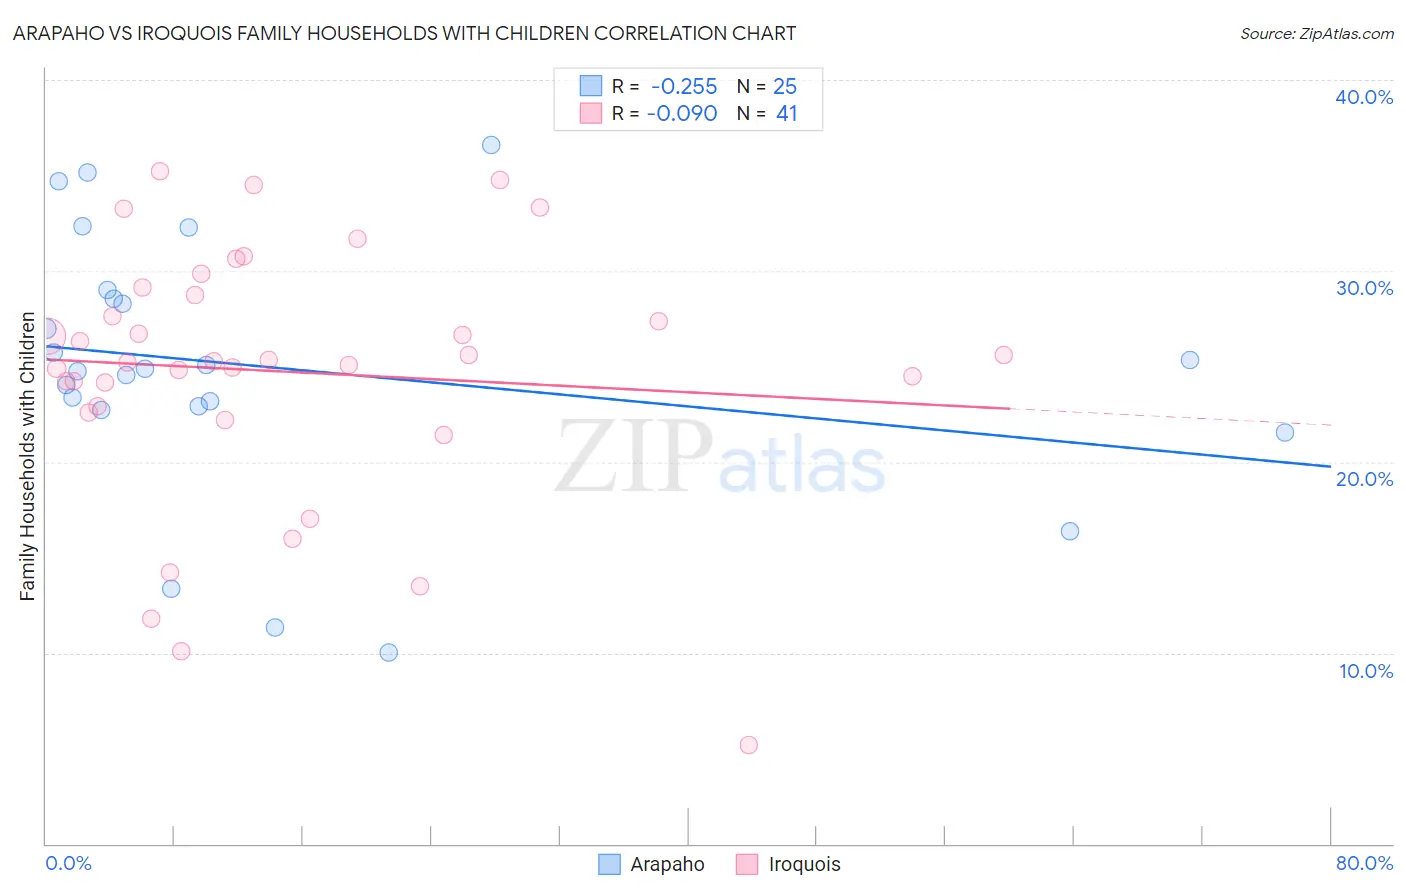
Arapaho vs Iroquois Family Households with Children Correlation Chart
The statistical analysis conducted on geographies consisting of 29,778,145 people shows a weak negative correlation between the proportion of Arapaho and percentage of family households with children in the United States with a correlation coefficient (R) of -0.255 and weighted average of 25.6%. Similarly, the statistical analysis conducted on geographies consisting of 207,224,284 people shows a slight negative correlation between the proportion of Iroquois and percentage of family households with children in the United States with a correlation coefficient (R) of -0.090 and weighted average of 26.1%, a difference of 1.9%.
Family Households with Children Correlation Summary
| Measurement | Arapaho | Iroquois |
| Minimum | 10.0% | 5.2% |
| Maximum | 36.6% | 35.2% |
| Range | 26.6% | 30.1% |
| Mean | 24.9% | 24.7% |
| Median | 24.9% | 25.3% |
| Interquartile 25% (IQ1) | 22.8% | 22.7% |
| Interquartile 75% (IQ3) | 28.8% | 29.0% |
| Interquartile Range (IQR) | 5.9% | 6.2% |
| Standard Deviation (Sample) | 6.9% | 6.8% |
| Standard Deviation (Population) | 6.7% | 6.7% |
Demographics Similar to Arapaho and Iroquois by Family Households with Children
In terms of family households with children, the demographic groups most similar to Arapaho are Puerto Rican (25.6%, a difference of 0.030%), Immigrants from West Indies (25.7%, a difference of 0.42%), Immigrants from Croatia (25.7%, a difference of 0.51%), Slovak (25.7%, a difference of 0.53%), and Immigrants from Switzerland (25.7%, a difference of 0.67%). Similarly, the demographic groups most similar to Iroquois are Immigrants from France (26.0%, a difference of 0.090%), Tlingit-Haida (26.0%, a difference of 0.10%), British West Indian (26.0%, a difference of 0.12%), Immigrants from Greece (26.0%, a difference of 0.13%), and Immigrants from Australia (26.0%, a difference of 0.16%).
| Demographics | Rating | Rank | Family Households with Children |
| Iroquois | 0.0 /100 | #318 | Tragic 26.1% |
| Immigrants | France | 0.0 /100 | #319 | Tragic 26.0% |
| Tlingit-Haida | 0.0 /100 | #320 | Tragic 26.0% |
| British West Indians | 0.0 /100 | #321 | Tragic 26.0% |
| Immigrants | Greece | 0.0 /100 | #322 | Tragic 26.0% |
| Immigrants | Australia | 0.0 /100 | #323 | Tragic 26.0% |
| Chinese | 0.0 /100 | #324 | Tragic 26.0% |
| Barbadians | 0.0 /100 | #325 | Tragic 26.0% |
| Immigrants | Ireland | 0.0 /100 | #326 | Tragic 26.0% |
| Immigrants | Barbados | 0.0 /100 | #327 | Tragic 26.0% |
| Immigrants | Albania | 0.0 /100 | #328 | Tragic 25.9% |
| Cypriots | 0.0 /100 | #329 | Tragic 25.9% |
| Immigrants | Latvia | 0.0 /100 | #330 | Tragic 25.9% |
| Slovenes | 0.0 /100 | #331 | Tragic 25.8% |
| Immigrants | Austria | 0.0 /100 | #332 | Tragic 25.8% |
| Immigrants | Switzerland | 0.0 /100 | #333 | Tragic 25.7% |
| Slovaks | 0.0 /100 | #334 | Tragic 25.7% |
| Immigrants | Croatia | 0.0 /100 | #335 | Tragic 25.7% |
| Immigrants | West Indies | 0.0 /100 | #336 | Tragic 25.7% |
| Puerto Ricans | 0.0 /100 | #337 | Tragic 25.6% |
| Arapaho | 0.0 /100 | #338 | Tragic 25.6% |