Immigrants from Switzerland vs Honduran Single Mother Households
COMPARE
Immigrants from Switzerland
Honduran
Single Mother Households
Single Mother Households Comparison
Immigrants from Switzerland
Hondurans
5.3%
SINGLE MOTHER HOUSEHOLDS
99.7/ 100
METRIC RATING
33rd/ 347
METRIC RANK
8.1%
SINGLE MOTHER HOUSEHOLDS
0.0/ 100
METRIC RATING
310th/ 347
METRIC RANK
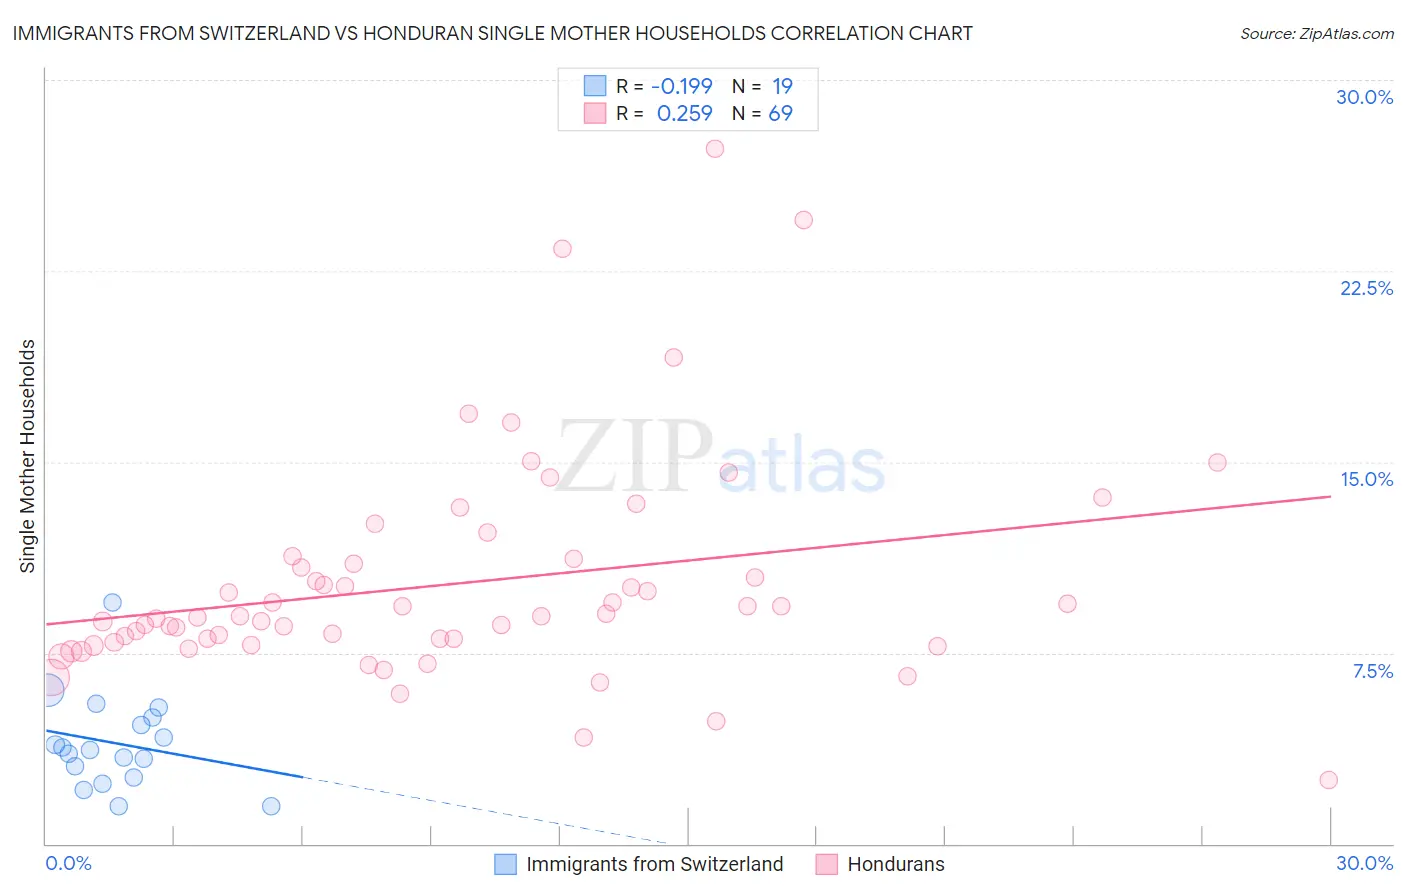
Immigrants from Switzerland vs Honduran Single Mother Households Correlation Chart
The statistical analysis conducted on geographies consisting of 147,838,806 people shows a poor negative correlation between the proportion of Immigrants from Switzerland and percentage of single mother households in the United States with a correlation coefficient (R) of -0.199 and weighted average of 5.3%. Similarly, the statistical analysis conducted on geographies consisting of 357,144,636 people shows a weak positive correlation between the proportion of Hondurans and percentage of single mother households in the United States with a correlation coefficient (R) of 0.259 and weighted average of 8.1%, a difference of 52.4%.
Single Mother Households Correlation Summary
| Measurement | Immigrants from Switzerland | Honduran |
| Minimum | 1.5% | 2.5% |
| Maximum | 9.5% | 27.3% |
| Range | 8.0% | 24.8% |
| Mean | 3.9% | 10.2% |
| Median | 3.7% | 8.9% |
| Interquartile 25% (IQ1) | 2.6% | 7.9% |
| Interquartile 75% (IQ3) | 5.0% | 11.1% |
| Interquartile Range (IQR) | 2.3% | 3.2% |
| Standard Deviation (Sample) | 1.9% | 4.4% |
| Standard Deviation (Population) | 1.8% | 4.3% |
Similar Demographics by Single Mother Households
Demographics Similar to Immigrants from Switzerland by Single Mother Households
In terms of single mother households, the demographic groups most similar to Immigrants from Switzerland are Bulgarian (5.3%, a difference of 0.020%), Immigrants from Northern Europe (5.3%, a difference of 0.060%), Immigrants from Czechoslovakia (5.3%, a difference of 0.26%), Cambodian (5.3%, a difference of 0.38%), and Immigrants from Korea (5.3%, a difference of 0.39%).
| Demographics | Rating | Rank | Single Mother Households |
| Immigrants | Lithuania | 99.8 /100 | #26 | Exceptional 5.3% |
| Bhutanese | 99.7 /100 | #27 | Exceptional 5.3% |
| Russians | 99.7 /100 | #28 | Exceptional 5.3% |
| Latvians | 99.7 /100 | #29 | Exceptional 5.3% |
| Burmese | 99.7 /100 | #30 | Exceptional 5.3% |
| Immigrants | Korea | 99.7 /100 | #31 | Exceptional 5.3% |
| Cambodians | 99.7 /100 | #32 | Exceptional 5.3% |
| Immigrants | Switzerland | 99.7 /100 | #33 | Exceptional 5.3% |
| Bulgarians | 99.7 /100 | #34 | Exceptional 5.3% |
| Immigrants | Northern Europe | 99.7 /100 | #35 | Exceptional 5.3% |
| Immigrants | Czechoslovakia | 99.7 /100 | #36 | Exceptional 5.3% |
| Immigrants | Belgium | 99.7 /100 | #37 | Exceptional 5.3% |
| Immigrants | Serbia | 99.6 /100 | #38 | Exceptional 5.4% |
| Immigrants | Sweden | 99.6 /100 | #39 | Exceptional 5.4% |
| Estonians | 99.6 /100 | #40 | Exceptional 5.4% |
Demographics Similar to Hondurans by Single Mother Households
In terms of single mother households, the demographic groups most similar to Hondurans are Cheyenne (8.1%, a difference of 0.050%), Immigrants from Congo (8.1%, a difference of 0.29%), Immigrants from Central America (8.1%, a difference of 0.50%), Immigrants from St. Vincent and the Grenadines (8.0%, a difference of 0.51%), and Bangladeshi (8.1%, a difference of 0.59%).
| Demographics | Rating | Rank | Single Mother Households |
| Immigrants | Bahamas | 0.0 /100 | #303 | Tragic 8.0% |
| Natives/Alaskans | 0.0 /100 | #304 | Tragic 8.0% |
| Colville | 0.0 /100 | #305 | Tragic 8.0% |
| Immigrants | Barbados | 0.0 /100 | #306 | Tragic 8.0% |
| Immigrants | St. Vincent and the Grenadines | 0.0 /100 | #307 | Tragic 8.0% |
| Immigrants | Central America | 0.0 /100 | #308 | Tragic 8.1% |
| Cheyenne | 0.0 /100 | #309 | Tragic 8.1% |
| Hondurans | 0.0 /100 | #310 | Tragic 8.1% |
| Immigrants | Congo | 0.0 /100 | #311 | Tragic 8.1% |
| Bangladeshis | 0.0 /100 | #312 | Tragic 8.1% |
| Immigrants | Grenada | 0.0 /100 | #313 | Tragic 8.2% |
| Immigrants | Mexico | 0.0 /100 | #314 | Tragic 8.2% |
| Immigrants | Western Africa | 0.0 /100 | #315 | Tragic 8.2% |
| Africans | 0.0 /100 | #316 | Tragic 8.2% |
| Immigrants | Honduras | 0.0 /100 | #317 | Tragic 8.2% |