Immigrants from Sweden vs Venezuelan Family Households
COMPARE
Immigrants from Sweden
Venezuelan
Family Households
Family Households Comparison
Immigrants from Sweden
Venezuelans
62.5%
FAMILY HOUSEHOLDS
0.0/ 100
METRIC RATING
293rd/ 347
METRIC RANK
66.5%
FAMILY HOUSEHOLDS
100.0/ 100
METRIC RATING
45th/ 347
METRIC RANK
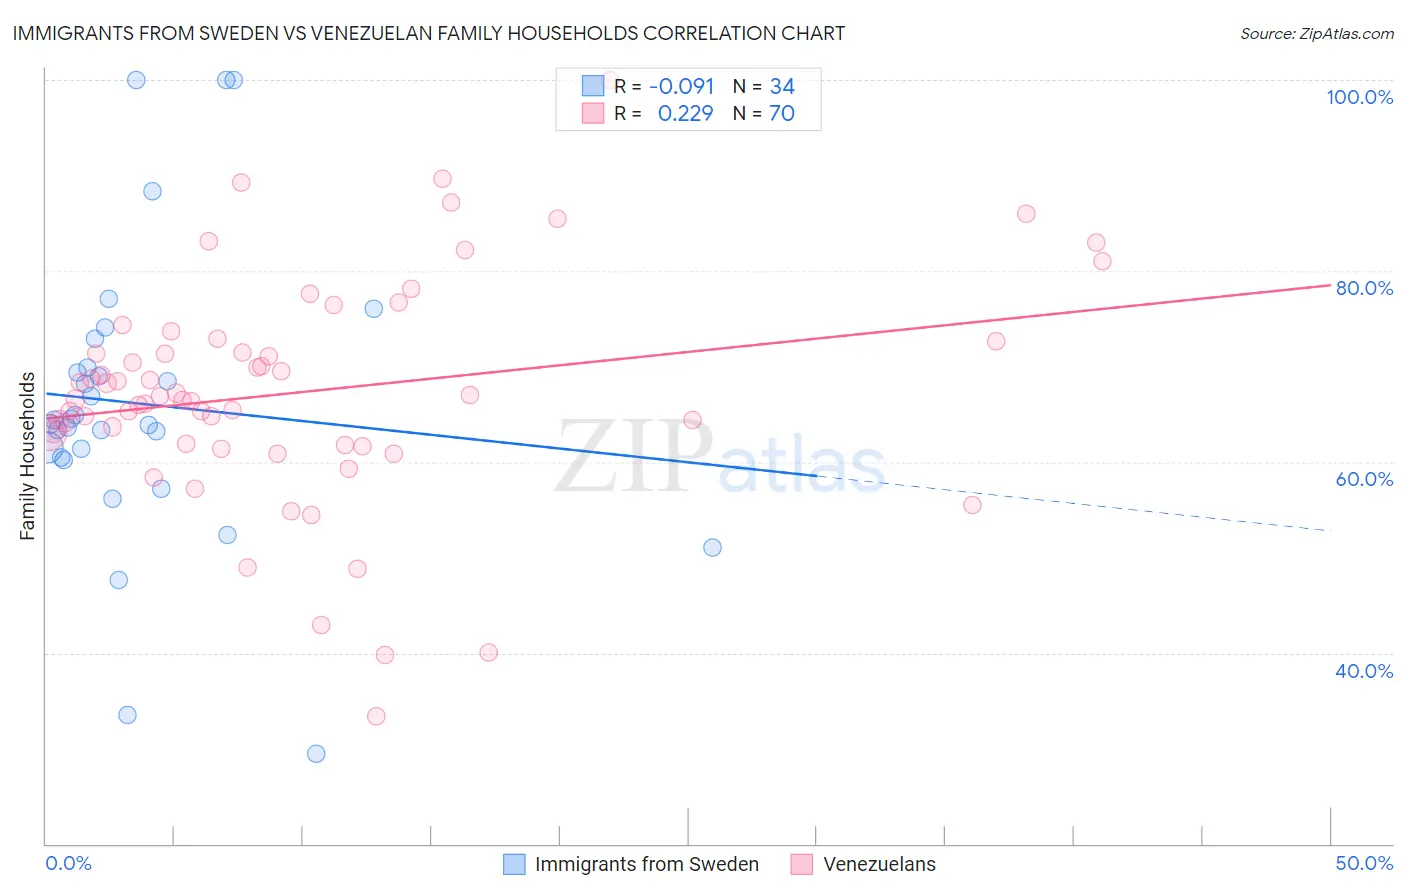
Immigrants from Sweden vs Venezuelan Family Households Correlation Chart
The statistical analysis conducted on geographies consisting of 164,705,416 people shows a slight negative correlation between the proportion of Immigrants from Sweden and percentage of family households in the United States with a correlation coefficient (R) of -0.091 and weighted average of 62.5%. Similarly, the statistical analysis conducted on geographies consisting of 306,138,924 people shows a weak positive correlation between the proportion of Venezuelans and percentage of family households in the United States with a correlation coefficient (R) of 0.229 and weighted average of 66.5%, a difference of 6.4%.
Family Households Correlation Summary
| Measurement | Immigrants from Sweden | Venezuelan |
| Minimum | 29.4% | 33.3% |
| Maximum | 100.0% | 100.0% |
| Range | 70.6% | 66.7% |
| Mean | 66.1% | 67.3% |
| Median | 64.2% | 66.7% |
| Interquartile 25% (IQ1) | 60.5% | 61.9% |
| Interquartile 75% (IQ3) | 69.9% | 72.7% |
| Interquartile Range (IQR) | 9.4% | 10.7% |
| Standard Deviation (Sample) | 15.4% | 11.8% |
| Standard Deviation (Population) | 15.2% | 11.7% |
Similar Demographics by Family Households
Demographics Similar to Immigrants from Sweden by Family Households
In terms of family households, the demographic groups most similar to Immigrants from Sweden are Barbadian (62.5%, a difference of 0.060%), Okinawan (62.5%, a difference of 0.080%), Slovene (62.4%, a difference of 0.090%), French American Indian (62.4%, a difference of 0.10%), and Immigrants from Burma/Myanmar (62.6%, a difference of 0.13%).
| Demographics | Rating | Rank | Family Households |
| British West Indians | 0.1 /100 | #286 | Tragic 62.8% |
| Latvians | 0.1 /100 | #287 | Tragic 62.8% |
| Immigrants | Uganda | 0.1 /100 | #288 | Tragic 62.7% |
| Immigrants | Nepal | 0.1 /100 | #289 | Tragic 62.7% |
| Immigrants | Grenada | 0.0 /100 | #290 | Tragic 62.6% |
| U.S. Virgin Islanders | 0.0 /100 | #291 | Tragic 62.6% |
| Immigrants | Burma/Myanmar | 0.0 /100 | #292 | Tragic 62.6% |
| Immigrants | Sweden | 0.0 /100 | #293 | Tragic 62.5% |
| Barbadians | 0.0 /100 | #294 | Tragic 62.5% |
| Okinawans | 0.0 /100 | #295 | Tragic 62.5% |
| Slovenes | 0.0 /100 | #296 | Tragic 62.4% |
| French American Indians | 0.0 /100 | #297 | Tragic 62.4% |
| Immigrants | Spain | 0.0 /100 | #298 | Tragic 62.4% |
| Immigrants | Kuwait | 0.0 /100 | #299 | Tragic 62.4% |
| Immigrants | Africa | 0.0 /100 | #300 | Tragic 62.4% |
Demographics Similar to Venezuelans by Family Households
In terms of family households, the demographic groups most similar to Venezuelans are Asian (66.5%, a difference of 0.020%), Arapaho (66.5%, a difference of 0.020%), Bolivian (66.5%, a difference of 0.050%), Apache (66.5%, a difference of 0.070%), and Immigrants from Venezuela (66.4%, a difference of 0.070%).
| Demographics | Rating | Rank | Family Households |
| Mexican American Indians | 100.0 /100 | #38 | Exceptional 67.0% |
| Immigrants | El Salvador | 100.0 /100 | #39 | Exceptional 67.0% |
| Guamanians/Chamorros | 100.0 /100 | #40 | Exceptional 66.6% |
| Immigrants | Bolivia | 100.0 /100 | #41 | Exceptional 66.6% |
| Menominee | 100.0 /100 | #42 | Exceptional 66.5% |
| Apache | 100.0 /100 | #43 | Exceptional 66.5% |
| Asians | 100.0 /100 | #44 | Exceptional 66.5% |
| Venezuelans | 100.0 /100 | #45 | Exceptional 66.5% |
| Arapaho | 100.0 /100 | #46 | Exceptional 66.5% |
| Bolivians | 100.0 /100 | #47 | Exceptional 66.5% |
| Immigrants | Venezuela | 100.0 /100 | #48 | Exceptional 66.4% |
| Immigrants | South Central Asia | 100.0 /100 | #49 | Exceptional 66.4% |
| Navajo | 100.0 /100 | #50 | Exceptional 66.4% |
| Natives/Alaskans | 100.0 /100 | #51 | Exceptional 66.4% |
| Colombians | 100.0 /100 | #52 | Exceptional 66.3% |