Immigrants from South Central Asia vs Immigrants from Zaire Family Households with Children

COMPARE

Immigrants from South Central Asia
Race
Ancestry
AfghanAfricanAlaska NativeAlaskan AthabascanAlbanianAleutAlsatianAmericanApacheArabArapahoArgentineanArmenianAssyrian/Chaldean/SyriacAustralianAustrianBahamianBangladeshiBarbadianBasqueBelgianBelizeanBermudanBhutaneseBlackfeetBolivianBrazilianBritishBritish West IndianBulgarianBurmeseCajunCambodianCanadianCape VerdeanCarpatho RusynCelticCentral AmericanCentral American IndianCherokeeCheyenneChickasawChileanChineseChippewaChoctawColombianColvilleComancheCosta RicanCreeCreekCroatianCrowCubanCypriotCzechCzechoslovakianDanishDelawareDominicanDutchDutch West IndianEastern EuropeanEcuadorianEgyptianEnglishEstonianEthiopianEuropeanFijianFilipinoFinnishFrenchFrench American IndianFrench CanadianGermanGerman RussianGhanaianGreekGuamanian/ChamorroGuatemalanGuyaneseHaitianHmongHonduranHopiHoumaHungarianIcelanderIndian (Asian)IndonesianInupiatIranianIraqiIrishIroquoisIsraeliItalianJamaicanJapaneseJordanianKenyanKiowaKoreanLaotianLatvianLebaneseLiberianLithuanianLumbeeLuxembourgerMacedonianMalaysianMalteseMarshalleseMenomineeMexicanMexican American IndianMongolianMoroccanNative HawaiianNavajoNepaleseNew ZealanderNicaraguanNigerianNorthern EuropeanNorwegianOkinawanOsageOttawaPaiutePakistaniPalestinianPanamanianParaguayanPennsylvania GermanPeruvianPimaPolishPortuguesePotawatomiPuebloPuerto RicanPuget Sound SalishRomanianRussianSalvadoranSamoanScandinavianScotch-IrishScottishSeminoleSenegaleseSerbianShoshoneSierra LeoneanSiouxSlavicSlovakSloveneSomaliSouth AfricanSouth AmericanSouth American IndianSoviet UnionSpaniardSpanishSpanish AmericanSpanish American IndianSri LankanSubsaharan AfricanSudaneseSwedishSwissSyrianTaiwaneseThaiTlingit-HaidaTohono O'OdhamTonganTrinidadian and TobagonianTsimshianTurkishU.S. Virgin IslanderUgandanUkrainianUruguayanUteVenezuelanVietnameseWelshWest IndianYakamaYaquiYugoslavianYumanYup'ikZimbabwean
Immigration
NonimmigrantsImmigrantsAfghanistanAfricaAlbaniaArgentinaArmeniaAsiaAustraliaAustriaBahamasBangladeshBarbadosBelarusBelgiumBelizeBoliviaBosnia and HerzegovinaBrazilBulgariaBurma/MyanmarCabo VerdeCambodiaCameroonCanadaCaribbeanCentral AmericaChileChinaColombiaCongoCosta RicaCroatiaCubaCzechoslovakiaDenmarkDominicaDominican RepublicEastern AfricaEastern AsiaEastern EuropeEcuadorEgyptEl SalvadorEnglandEritreaEthiopiaEuropeFijiFranceGermanyGhanaGreeceGrenadaGuatemalaGuyanaHaitiHondurasHong KongHungaryIndiaIndonesiaIranIraqIrelandIsraelItalyJamaicaJapanJordanKazakhstanKenyaKoreaKuwaitLaosLatin AmericaLatviaLebanonLiberiaLithuaniaMalaysiaMexicoMicronesiaMiddle AfricaMoldovaMoroccoNepalNetherlandsNicaraguaNigeriaNorth AmericaNorth MacedoniaNorthern AfricaNorthern EuropeNorwayOceaniaPakistanPanamaPeruPhilippinesPolandPortugalRomaniaRussiaSaudi ArabiaScotlandSenegalSerbiaSierra LeoneSingaporeSomaliaSouth AfricaSouth AmericaSouth Central AsiaSouth Eastern AsiaSouthern EuropeSpainSri LankaSt. Vincent and the GrenadinesSudanSwedenSwitzerlandSyriaTaiwanThailandTrinidad and TobagoTurkeyUgandaUkraineUruguayUzbekistanVenezuelaVietnamWest IndiesWestern AfricaWestern AsiaWestern EuropeYemenZimbabweAzores
Immigrants from Zaire
Race
Ancestry
AfghanAfricanAlaska NativeAlaskan AthabascanAlbanianAleutAlsatianAmericanApacheArabArapahoArgentineanArmenianAssyrian/Chaldean/SyriacAustralianAustrianBahamianBangladeshiBarbadianBasqueBelgianBelizeanBermudanBhutaneseBlackfeetBolivianBrazilianBritishBritish West IndianBulgarianBurmeseCajunCambodianCanadianCape VerdeanCarpatho RusynCelticCentral AmericanCentral American IndianCherokeeCheyenneChickasawChileanChineseChippewaChoctawColombianColvilleComancheCosta RicanCreeCreekCroatianCrowCubanCypriotCzechCzechoslovakianDanishDelawareDominicanDutchDutch West IndianEastern EuropeanEcuadorianEgyptianEnglishEstonianEthiopianEuropeanFijianFilipinoFinnishFrenchFrench American IndianFrench CanadianGermanGerman RussianGhanaianGreekGuamanian/ChamorroGuatemalanGuyaneseHaitianHmongHonduranHopiHoumaHungarianIcelanderIndian (Asian)IndonesianInupiatIranianIraqiIrishIroquoisIsraeliItalianJamaicanJapaneseJordanianKenyanKiowaKoreanLaotianLatvianLebaneseLiberianLithuanianLumbeeLuxembourgerMacedonianMalaysianMalteseMarshalleseMenomineeMexicanMexican American IndianMongolianMoroccanNative HawaiianNavajoNepaleseNew ZealanderNicaraguanNigerianNorthern EuropeanNorwegianOkinawanOsageOttawaPaiutePakistaniPalestinianPanamanianParaguayanPennsylvania GermanPeruvianPimaPolishPortuguesePotawatomiPuebloPuerto RicanPuget Sound SalishRomanianRussianSalvadoranSamoanScandinavianScotch-IrishScottishSeminoleSenegaleseSerbianShoshoneSierra LeoneanSiouxSlavicSlovakSloveneSomaliSouth AfricanSouth AmericanSouth American IndianSoviet UnionSpaniardSpanishSpanish AmericanSpanish American IndianSri LankanSubsaharan AfricanSudaneseSwedishSwissSyrianTaiwaneseThaiTlingit-HaidaTohono O'OdhamTonganTrinidadian and TobagonianTsimshianTurkishU.S. Virgin IslanderUgandanUkrainianUruguayanUteVenezuelanVietnameseWelshWest IndianYakamaYaquiYugoslavianYumanYup'ikZimbabwean
Immigration
NonimmigrantsImmigrantsAfghanistanAfricaAlbaniaArgentinaArmeniaAsiaAustraliaAustriaBahamasBangladeshBarbadosBelarusBelgiumBelizeBoliviaBosnia and HerzegovinaBrazilBulgariaBurma/MyanmarCabo VerdeCambodiaCameroonCanadaCaribbeanCentral AmericaChileChinaColombiaCongoCosta RicaCroatiaCubaCzechoslovakiaDenmarkDominicaDominican RepublicEastern AfricaEastern AsiaEastern EuropeEcuadorEgyptEl SalvadorEnglandEritreaEthiopiaEuropeFijiFranceGermanyGhanaGreeceGrenadaGuatemalaGuyanaHaitiHondurasHong KongHungaryIndiaIndonesiaIranIraqIrelandIsraelItalyJamaicaJapanJordanKazakhstanKenyaKoreaKuwaitLaosLatin AmericaLatviaLebanonLiberiaLithuaniaMalaysiaMexicoMicronesiaMiddle AfricaMoldovaMoroccoNepalNetherlandsNicaraguaNigeriaNorth AmericaNorth MacedoniaNorthern AfricaNorthern EuropeNorwayOceaniaPakistanPanamaPeruPhilippinesPolandPortugalRomaniaRussiaSaudi ArabiaScotlandSenegalSerbiaSierra LeoneSingaporeSomaliaSouth AfricaSouth AmericaSouth Eastern AsiaSouthern EuropeSpainSri LankaSt. Vincent and the GrenadinesSudanSwedenSwitzerlandSyriaTaiwanThailandTrinidad and TobagoTurkeyUgandaUkraineUruguayUzbekistanVenezuelaVietnamWest IndiesWestern AfricaWestern AsiaWestern EuropeYemenZaireZimbabweAzores
Family Households with Children
Income
Poverty
Unemployment
Labor Participation
Family Structure
Vehicle Availability
Education Level
Disability

Family Households with Children Comparison

Immigrants from South Central Asia

Immigrants from Zaire

Exceptional
Tragic
30.0%
FAMILY HOUSEHOLDS WITH CHILDREN
100.0/ 100
METRIC RATING
15th/ 347
METRIC RANK
26.7%
FAMILY HOUSEHOLDS WITH CHILDREN
0.7/ 100
METRIC RATING
270th/ 347
METRIC RANK

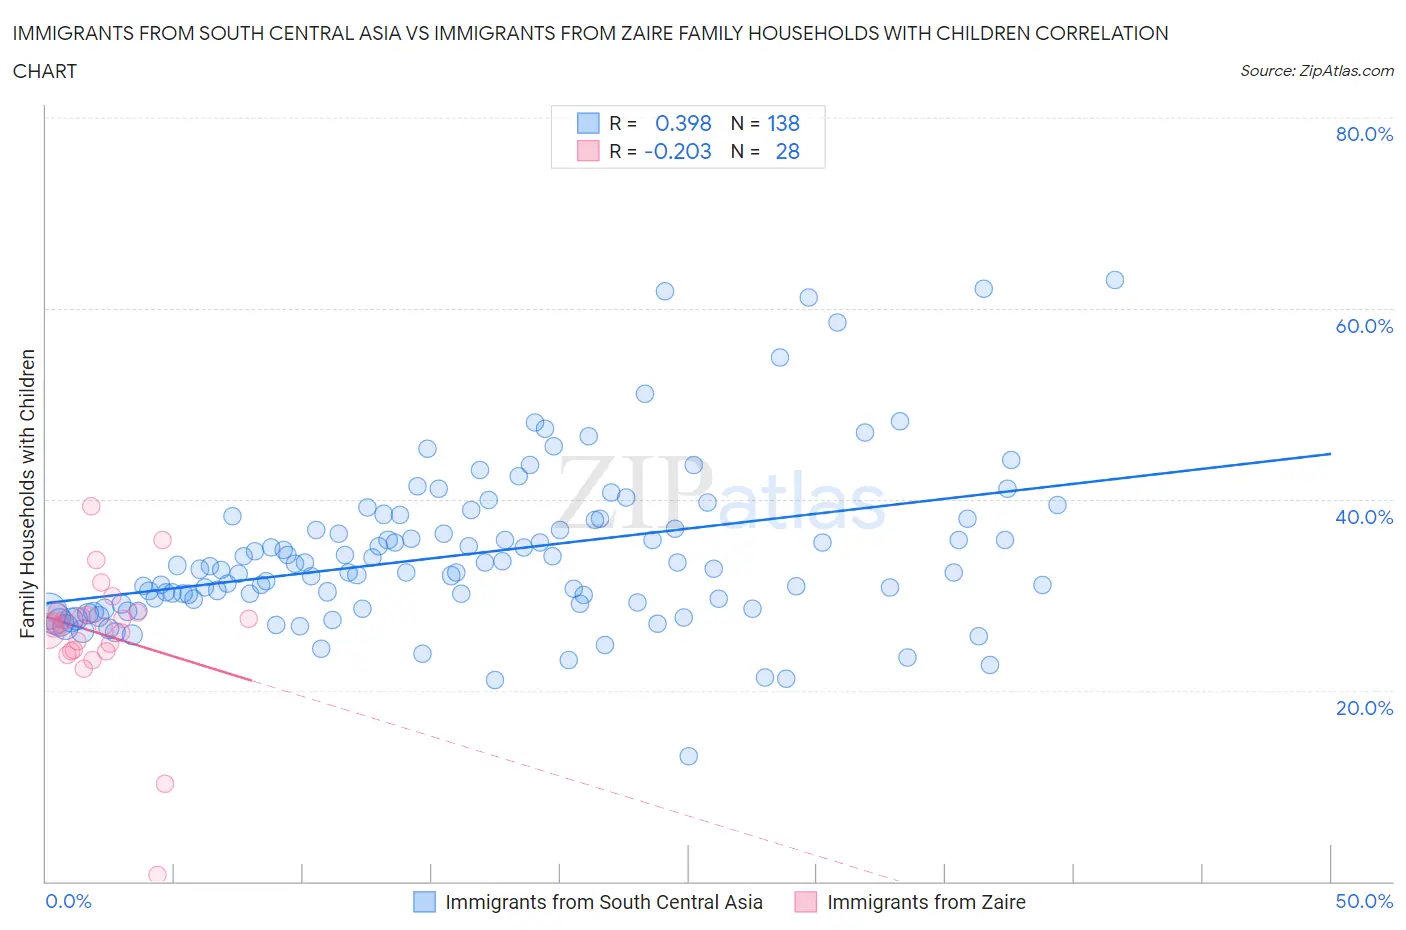
Immigrants from South Central Asia vs Immigrants from Zaire Family Households with Children Correlation Chart

The statistical analysis conducted on geographies consisting of 472,487,165 people shows a mild positive correlation between the proportion of Immigrants from South Central Asia and percentage of family households with children in the United States with a correlation coefficient (R) of 0.398 and weighted average of 30.0%. Similarly, the statistical analysis conducted on geographies consisting of 107,243,264 people shows a weak negative correlation between the proportion of Immigrants from Zaire and percentage of family households with children in the United States with a correlation coefficient (R) of -0.203 and weighted average of 26.7%, a difference of 12.5%.
Immigrants from South Central Asia vs Immigrants from Zaire Family Households with Children

Family Households with Children Correlation Summary

MeasurementImmigrants from South Central AsiaImmigrants from Zaire
Minimum13.1%0.70%
Maximum63.0%39.2%
Range49.9%38.5%
Mean34.2%25.9%
Median32.7%26.8%
Interquartile 25% (IQ1)29.0%24.2%
Interquartile 75% (IQ3)37.9%28.0%
Interquartile Range (IQR)8.9%3.8%
Standard Deviation (Sample)8.4%7.0%
Standard Deviation (Population)8.4%6.9%

Similar Demographics by Family Households with Children

Demographics Similar to Immigrants from South Central Asia by Family Households with Children

In terms of family households with children, the demographic groups most similar to Immigrants from South Central Asia are Immigrants from Afghanistan (30.0%, a difference of 0.020%), Bangladeshi (30.1%, a difference of 0.17%), Hispanic or Latino (29.9%, a difference of 0.41%), Afghan (30.2%, a difference of 0.46%), and Salvadoran (29.9%, a difference of 0.60%).
DemographicsRating | RankFamily Households with Children
Yakama
100.0
/100
|
#8
Exceptional
30.8%
Thais
100.0
/100
|
#9
Exceptional
30.6%
Immigrants | Fiji
100.0
/100
|
#10
Exceptional
30.5%
Nepalese
100.0
/100
|
#11
Exceptional
30.5%
Immigrants | Pakistan
100.0
/100
|
#12
Exceptional
30.2%
Afghans
100.0
/100
|
#13
Exceptional
30.2%
Bangladeshis
100.0
/100
|
#14
Exceptional
30.1%
Immigrants | South Central Asia
100.0
/100
|
#15
Exceptional
30.0%
Immigrants | Afghanistan
100.0
/100
|
#16
Exceptional
30.0%
Hispanics or Latinos
100.0
/100
|
#17
Exceptional
29.9%
Salvadorans
100.0
/100
|
#18
Exceptional
29.9%
Alaska Natives
100.0
/100
|
#19
Exceptional
29.9%
Immigrants | El Salvador
100.0
/100
|
#20
Exceptional
29.8%
Immigrants | Laos
100.0
/100
|
#21
Exceptional
29.8%
Malaysians
100.0
/100
|
#22
Exceptional
29.8%

Demographics Similar to Immigrants from Zaire by Family Households with Children

In terms of family households with children, the demographic groups most similar to Immigrants from Zaire are French (26.7%, a difference of 0.010%), Immigrants from Denmark (26.7%, a difference of 0.050%), Somali (26.7%, a difference of 0.080%), Immigrants from Belgium (26.7%, a difference of 0.10%), and Chippewa (26.7%, a difference of 0.11%).
DemographicsRating | RankFamily Households with Children
Immigrants | North Macedonia
1.0
/100
|
#263
Tragic
26.7%
Taiwanese
0.9
/100
|
#264
Tragic
26.7%
Chippewa
0.9
/100
|
#265
Tragic
26.7%
Maltese
0.9
/100
|
#266
Tragic
26.7%
Immigrants | Uzbekistan
0.9
/100
|
#267
Tragic
26.7%
Immigrants | Belgium
0.9
/100
|
#268
Tragic
26.7%
Immigrants | Denmark
0.8
/100
|
#269
Tragic
26.7%
Immigrants | Zaire
0.7
/100
|
#270
Tragic
26.7%
French
0.7
/100
|
#271
Tragic
26.7%
Somalis
0.7
/100
|
#272
Tragic
26.7%
Immigrants | Hungary
0.6
/100
|
#273
Tragic
26.7%
Eastern Europeans
0.6
/100
|
#274
Tragic
26.7%
Immigrants | Northern Europe
0.5
/100
|
#275
Tragic
26.7%
Immigrants | Spain
0.5
/100
|
#276
Tragic
26.6%
Celtics
0.4
/100
|
#277
Tragic
26.6%