Immigrants from Singapore vs Shoshone Family Households
COMPARE
Immigrants from Singapore
Shoshone
Family Households
Family Households Comparison
Immigrants from Singapore
Shoshone
63.1%
FAMILY HOUSEHOLDS
0.4/ 100
METRIC RATING
268th/ 347
METRIC RANK
63.8%
FAMILY HOUSEHOLDS
9.4/ 100
METRIC RATING
211th/ 347
METRIC RANK
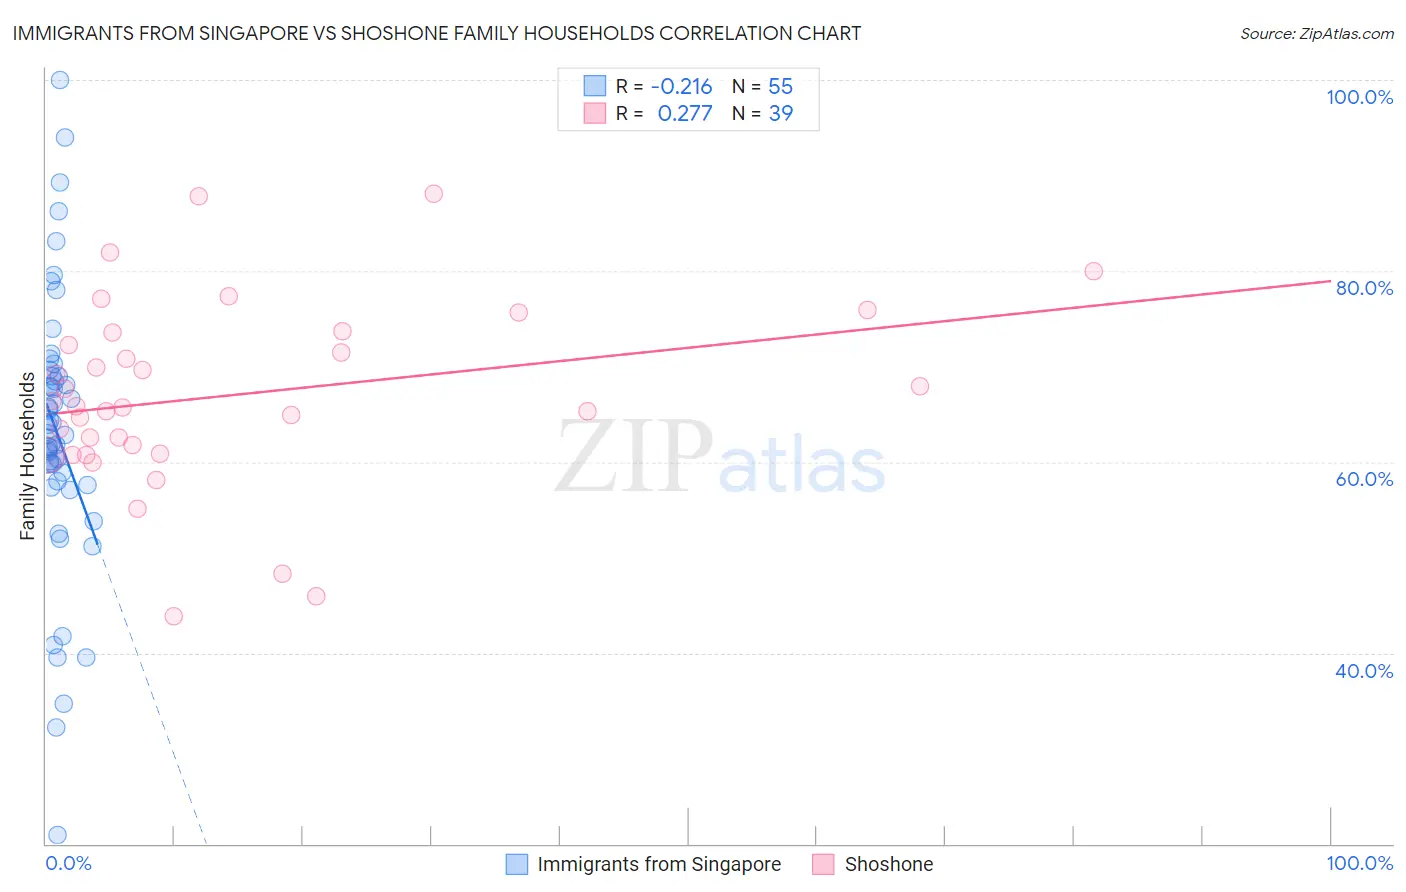
Immigrants from Singapore vs Shoshone Family Households Correlation Chart
The statistical analysis conducted on geographies consisting of 137,456,675 people shows a weak negative correlation between the proportion of Immigrants from Singapore and percentage of family households in the United States with a correlation coefficient (R) of -0.216 and weighted average of 63.1%. Similarly, the statistical analysis conducted on geographies consisting of 66,615,877 people shows a weak positive correlation between the proportion of Shoshone and percentage of family households in the United States with a correlation coefficient (R) of 0.277 and weighted average of 63.8%, a difference of 1.1%.
Family Households Correlation Summary
| Measurement | Immigrants from Singapore | Shoshone |
| Minimum | 20.9% | 43.8% |
| Maximum | 100.0% | 88.1% |
| Range | 79.1% | 44.3% |
| Mean | 62.9% | 67.0% |
| Median | 62.9% | 65.9% |
| Interquartile 25% (IQ1) | 57.5% | 60.9% |
| Interquartile 75% (IQ3) | 69.0% | 73.5% |
| Interquartile Range (IQR) | 11.5% | 12.6% |
| Standard Deviation (Sample) | 14.6% | 9.8% |
| Standard Deviation (Population) | 14.5% | 9.7% |
Similar Demographics by Family Households
Demographics Similar to Immigrants from Singapore by Family Households
In terms of family households, the demographic groups most similar to Immigrants from Singapore are Yugoslavian (63.1%, a difference of 0.0%), Immigrants from Austria (63.1%, a difference of 0.020%), Immigrants from Croatia (63.1%, a difference of 0.030%), Immigrants from Turkey (63.1%, a difference of 0.030%), and Immigrants from Kazakhstan (63.1%, a difference of 0.040%).
| Demographics | Rating | Rank | Family Households |
| Immigrants | Russia | 0.6 /100 | #261 | Tragic 63.2% |
| Immigrants | Ireland | 0.6 /100 | #262 | Tragic 63.2% |
| Cheyenne | 0.5 /100 | #263 | Tragic 63.2% |
| Kenyans | 0.5 /100 | #264 | Tragic 63.2% |
| Colville | 0.5 /100 | #265 | Tragic 63.2% |
| Immigrants | Western Africa | 0.5 /100 | #266 | Tragic 63.1% |
| Israelis | 0.4 /100 | #267 | Tragic 63.1% |
| Immigrants | Singapore | 0.4 /100 | #268 | Tragic 63.1% |
| Yugoslavians | 0.4 /100 | #269 | Tragic 63.1% |
| Immigrants | Austria | 0.3 /100 | #270 | Tragic 63.1% |
| Immigrants | Croatia | 0.3 /100 | #271 | Tragic 63.1% |
| Immigrants | Turkey | 0.3 /100 | #272 | Tragic 63.1% |
| Immigrants | Kazakhstan | 0.3 /100 | #273 | Tragic 63.1% |
| Lumbee | 0.3 /100 | #274 | Tragic 63.1% |
| West Indians | 0.3 /100 | #275 | Tragic 63.1% |
Demographics Similar to Shoshone by Family Households
In terms of family households, the demographic groups most similar to Shoshone are Immigrants from Netherlands (63.8%, a difference of 0.0%), Immigrants from Thailand (63.8%, a difference of 0.010%), Immigrants from Northern Europe (63.8%, a difference of 0.020%), Celtic (63.8%, a difference of 0.060%), and Nigerian (63.9%, a difference of 0.070%).
| Demographics | Rating | Rank | Family Households |
| Immigrants | Uruguay | 12.8 /100 | #204 | Poor 63.9% |
| Brazilians | 12.4 /100 | #205 | Poor 63.9% |
| Immigrants | Lithuania | 12.1 /100 | #206 | Poor 63.9% |
| Nigerians | 11.5 /100 | #207 | Poor 63.9% |
| Immigrants | Bangladesh | 11.4 /100 | #208 | Poor 63.9% |
| Sierra Leoneans | 11.2 /100 | #209 | Poor 63.9% |
| Immigrants | Thailand | 9.6 /100 | #210 | Tragic 63.8% |
| Shoshone | 9.4 /100 | #211 | Tragic 63.8% |
| Immigrants | Netherlands | 9.4 /100 | #212 | Tragic 63.8% |
| Immigrants | Northern Europe | 8.8 /100 | #213 | Tragic 63.8% |
| Celtics | 8.0 /100 | #214 | Tragic 63.8% |
| Belgians | 7.6 /100 | #215 | Tragic 63.8% |
| Croatians | 7.3 /100 | #216 | Tragic 63.8% |
| Osage | 7.0 /100 | #217 | Tragic 63.7% |
| Marshallese | 6.9 /100 | #218 | Tragic 63.7% |