Immigrants from Poland vs Cape Verdean Currently Married
COMPARE
Immigrants from Poland
Cape Verdean
Currently Married
Currently Married Comparison
Immigrants from Poland
Cape Verdeans
48.1%
CURRENTLY MARRIED
96.9/ 100
METRIC RATING
80th/ 347
METRIC RANK
39.6%
CURRENTLY MARRIED
0.0/ 100
METRIC RATING
338th/ 347
METRIC RANK
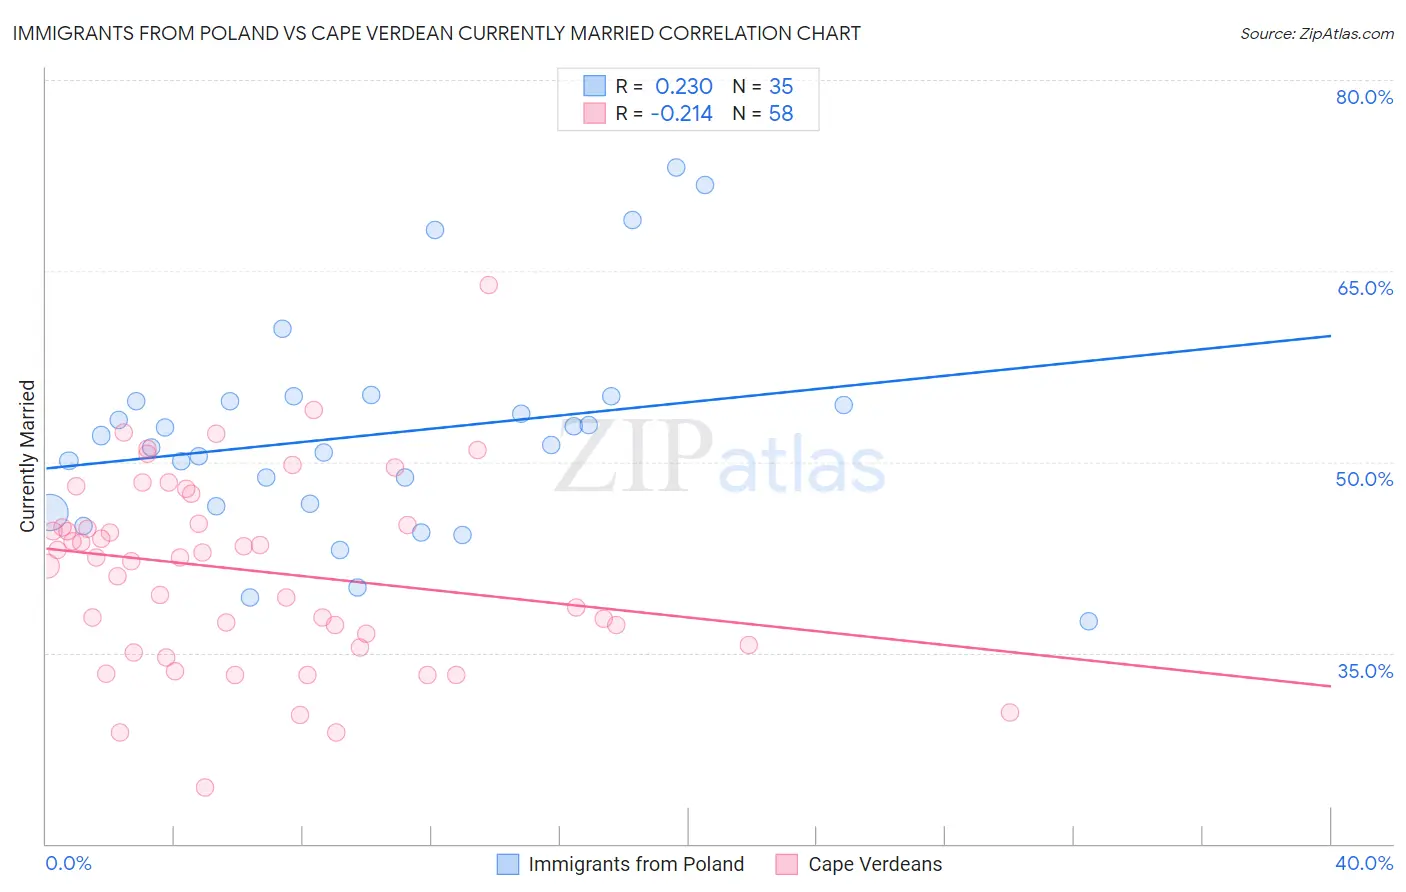
Immigrants from Poland vs Cape Verdean Currently Married Correlation Chart
The statistical analysis conducted on geographies consisting of 304,845,419 people shows a weak positive correlation between the proportion of Immigrants from Poland and percentage of population currently married in the United States with a correlation coefficient (R) of 0.230 and weighted average of 48.1%. Similarly, the statistical analysis conducted on geographies consisting of 107,578,938 people shows a weak negative correlation between the proportion of Cape Verdeans and percentage of population currently married in the United States with a correlation coefficient (R) of -0.214 and weighted average of 39.6%, a difference of 21.5%.
Currently Married Correlation Summary
| Measurement | Immigrants from Poland | Cape Verdean |
| Minimum | 37.5% | 24.4% |
| Maximum | 73.1% | 63.9% |
| Range | 35.6% | 39.5% |
| Mean | 52.1% | 41.5% |
| Median | 51.3% | 42.5% |
| Interquartile 25% (IQ1) | 46.5% | 35.6% |
| Interquartile 75% (IQ3) | 54.8% | 45.1% |
| Interquartile Range (IQR) | 8.3% | 9.5% |
| Standard Deviation (Sample) | 8.4% | 7.5% |
| Standard Deviation (Population) | 8.3% | 7.4% |
Similar Demographics by Currently Married
Demographics Similar to Immigrants from Poland by Currently Married
In terms of currently married, the demographic groups most similar to Immigrants from Poland are Immigrants from Sri Lanka (48.1%, a difference of 0.010%), Immigrants from Europe (48.1%, a difference of 0.010%), Bolivian (48.1%, a difference of 0.010%), Immigrants from Israel (48.1%, a difference of 0.020%), and Immigrants from South Africa (48.1%, a difference of 0.030%).
| Demographics | Rating | Rank | Currently Married |
| Immigrants | Eastern Asia | 97.5 /100 | #73 | Exceptional 48.2% |
| Estonians | 97.4 /100 | #74 | Exceptional 48.2% |
| Immigrants | Belarus | 97.2 /100 | #75 | Exceptional 48.1% |
| Basques | 97.2 /100 | #76 | Exceptional 48.1% |
| Slovenes | 97.1 /100 | #77 | Exceptional 48.1% |
| Immigrants | Belgium | 97.1 /100 | #78 | Exceptional 48.1% |
| Immigrants | South Africa | 97.0 /100 | #79 | Exceptional 48.1% |
| Immigrants | Poland | 96.9 /100 | #80 | Exceptional 48.1% |
| Immigrants | Sri Lanka | 96.9 /100 | #81 | Exceptional 48.1% |
| Immigrants | Europe | 96.9 /100 | #82 | Exceptional 48.1% |
| Bolivians | 96.9 /100 | #83 | Exceptional 48.1% |
| Immigrants | Israel | 96.9 /100 | #84 | Exceptional 48.1% |
| French Canadians | 96.3 /100 | #85 | Exceptional 48.0% |
| Immigrants | Japan | 96.2 /100 | #86 | Exceptional 48.0% |
| Jordanians | 96.2 /100 | #87 | Exceptional 48.0% |
Demographics Similar to Cape Verdeans by Currently Married
In terms of currently married, the demographic groups most similar to Cape Verdeans are Black/African American (39.6%, a difference of 0.090%), Dominican (39.5%, a difference of 0.15%), British West Indian (39.8%, a difference of 0.47%), Lumbee (39.8%, a difference of 0.65%), and Puerto Rican (39.9%, a difference of 0.81%).
| Demographics | Rating | Rank | Currently Married |
| Immigrants | Barbados | 0.0 /100 | #331 | Tragic 40.3% |
| Immigrants | St. Vincent and the Grenadines | 0.0 /100 | #332 | Tragic 40.1% |
| Yup'ik | 0.0 /100 | #333 | Tragic 39.9% |
| Puerto Ricans | 0.0 /100 | #334 | Tragic 39.9% |
| Lumbee | 0.0 /100 | #335 | Tragic 39.8% |
| British West Indians | 0.0 /100 | #336 | Tragic 39.8% |
| Blacks/African Americans | 0.0 /100 | #337 | Tragic 39.6% |
| Cape Verdeans | 0.0 /100 | #338 | Tragic 39.6% |
| Dominicans | 0.0 /100 | #339 | Tragic 39.5% |
| Immigrants | Grenada | 0.0 /100 | #340 | Tragic 39.1% |
| Navajo | 0.0 /100 | #341 | Tragic 39.0% |
| Immigrants | Dominican Republic | 0.0 /100 | #342 | Tragic 38.9% |
| Pueblo | 0.0 /100 | #343 | Tragic 38.2% |
| Immigrants | Cabo Verde | 0.0 /100 | #344 | Tragic 37.8% |
| Tohono O'odham | 0.0 /100 | #345 | Tragic 36.8% |