Immigrants from Morocco vs Dutch Average Family Size
COMPARE
Immigrants from Morocco
Dutch
Average Family Size
Average Family Size Comparison
Immigrants from Morocco
Dutch
3.21
AVERAGE FAMILY SIZE
18.5/ 100
METRIC RATING
201st/ 347
METRIC RANK
3.11
AVERAGE FAMILY SIZE
0.0/ 100
METRIC RATING
327th/ 347
METRIC RANK
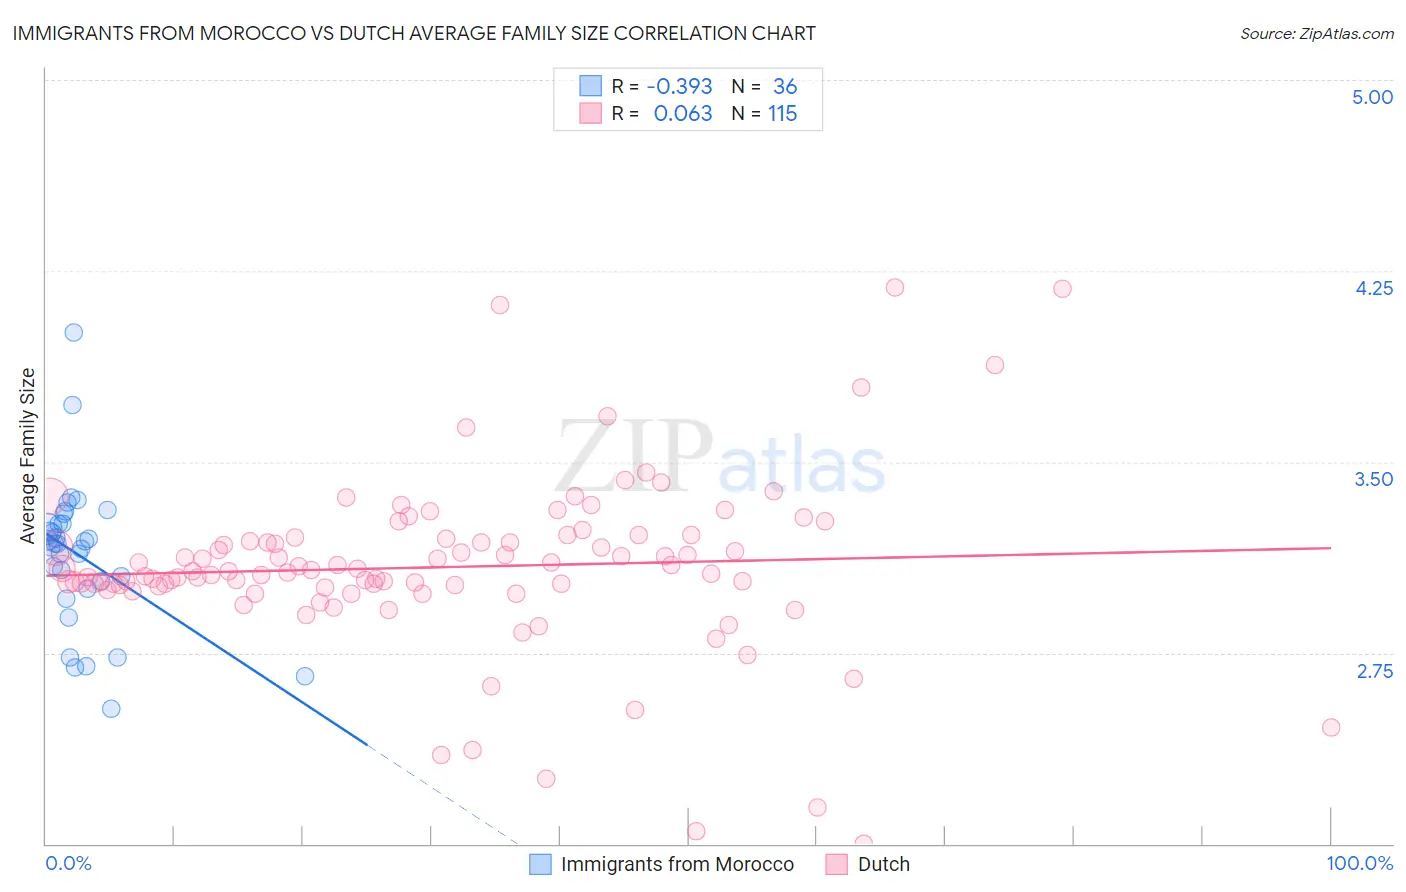
Immigrants from Morocco vs Dutch Average Family Size Correlation Chart
The statistical analysis conducted on geographies consisting of 178,909,598 people shows a mild negative correlation between the proportion of Immigrants from Morocco and average family size in the United States with a correlation coefficient (R) of -0.393 and weighted average of 3.21. Similarly, the statistical analysis conducted on geographies consisting of 553,876,215 people shows a slight positive correlation between the proportion of Dutch and average family size in the United States with a correlation coefficient (R) of 0.063 and weighted average of 3.11, a difference of 3.1%.
Average Family Size Correlation Summary
| Measurement | Immigrants from Morocco | Dutch |
| Minimum | 2.53 | 2.00 |
| Maximum | 4.01 | 4.19 |
| Range | 1.48 | 2.19 |
| Mean | 3.13 | 3.09 |
| Median | 3.18 | 3.07 |
| Interquartile 25% (IQ1) | 3.02 | 3.01 |
| Interquartile 75% (IQ3) | 3.26 | 3.20 |
| Interquartile Range (IQR) | 0.24 | 0.19 |
| Standard Deviation (Sample) | 0.29 | 0.34 |
| Standard Deviation (Population) | 0.28 | 0.34 |
Similar Demographics by Average Family Size
Demographics Similar to Immigrants from Morocco by Average Family Size
In terms of average family size, the demographic groups most similar to Immigrants from Morocco are Immigrants from India (3.21, a difference of 0.0%), Immigrants from Nepal (3.21, a difference of 0.010%), Immigrants from Kenya (3.21, a difference of 0.020%), Hmong (3.21, a difference of 0.060%), and Immigrants from Poland (3.20, a difference of 0.060%).
| Demographics | Rating | Rank | Average Family Size |
| Immigrants | Sudan | 29.1 /100 | #194 | Fair 3.22 |
| Choctaw | 28.3 /100 | #195 | Fair 3.21 |
| Senegalese | 28.2 /100 | #196 | Fair 3.21 |
| Kenyans | 28.0 /100 | #197 | Fair 3.21 |
| Immigrants | Azores | 21.7 /100 | #198 | Fair 3.21 |
| Hmong | 20.7 /100 | #199 | Fair 3.21 |
| Immigrants | Kenya | 19.2 /100 | #200 | Poor 3.21 |
| Immigrants | Morocco | 18.5 /100 | #201 | Poor 3.21 |
| Immigrants | India | 18.5 /100 | #202 | Poor 3.21 |
| Immigrants | Nepal | 18.1 /100 | #203 | Poor 3.21 |
| Immigrants | Poland | 16.6 /100 | #204 | Poor 3.20 |
| Paraguayans | 16.3 /100 | #205 | Poor 3.20 |
| Immigrants | Cabo Verde | 16.0 /100 | #206 | Poor 3.20 |
| Filipinos | 13.6 /100 | #207 | Poor 3.20 |
| Chippewa | 13.3 /100 | #208 | Poor 3.20 |
Demographics Similar to Dutch by Average Family Size
In terms of average family size, the demographic groups most similar to Dutch are Czech (3.11, a difference of 0.0%), Ottawa (3.11, a difference of 0.010%), English (3.11, a difference of 0.060%), Belgian (3.11, a difference of 0.060%), and Celtic (3.11, a difference of 0.10%).
| Demographics | Rating | Rank | Average Family Size |
| Immigrants | North America | 0.0 /100 | #320 | Tragic 3.12 |
| Immigrants | Austria | 0.0 /100 | #321 | Tragic 3.12 |
| Immigrants | Canada | 0.0 /100 | #322 | Tragic 3.12 |
| Soviet Union | 0.0 /100 | #323 | Tragic 3.11 |
| Celtics | 0.0 /100 | #324 | Tragic 3.11 |
| English | 0.0 /100 | #325 | Tragic 3.11 |
| Ottawa | 0.0 /100 | #326 | Tragic 3.11 |
| Dutch | 0.0 /100 | #327 | Tragic 3.11 |
| Czechs | 0.0 /100 | #328 | Tragic 3.11 |
| Belgians | 0.0 /100 | #329 | Tragic 3.11 |
| Latvians | 0.0 /100 | #330 | Tragic 3.11 |
| Scotch-Irish | 0.0 /100 | #331 | Tragic 3.11 |
| Scottish | 0.0 /100 | #332 | Tragic 3.11 |
| Estonians | 0.0 /100 | #333 | Tragic 3.10 |
| Lithuanians | 0.0 /100 | #334 | Tragic 3.10 |