Immigrants from Serbia vs Dutch Average Family Size
COMPARE
Immigrants from Serbia
Dutch
Average Family Size
Average Family Size Comparison
Immigrants from Serbia
Dutch
3.13
AVERAGE FAMILY SIZE
0.1/ 100
METRIC RATING
307th/ 347
METRIC RANK
3.11
AVERAGE FAMILY SIZE
0.0/ 100
METRIC RATING
327th/ 347
METRIC RANK
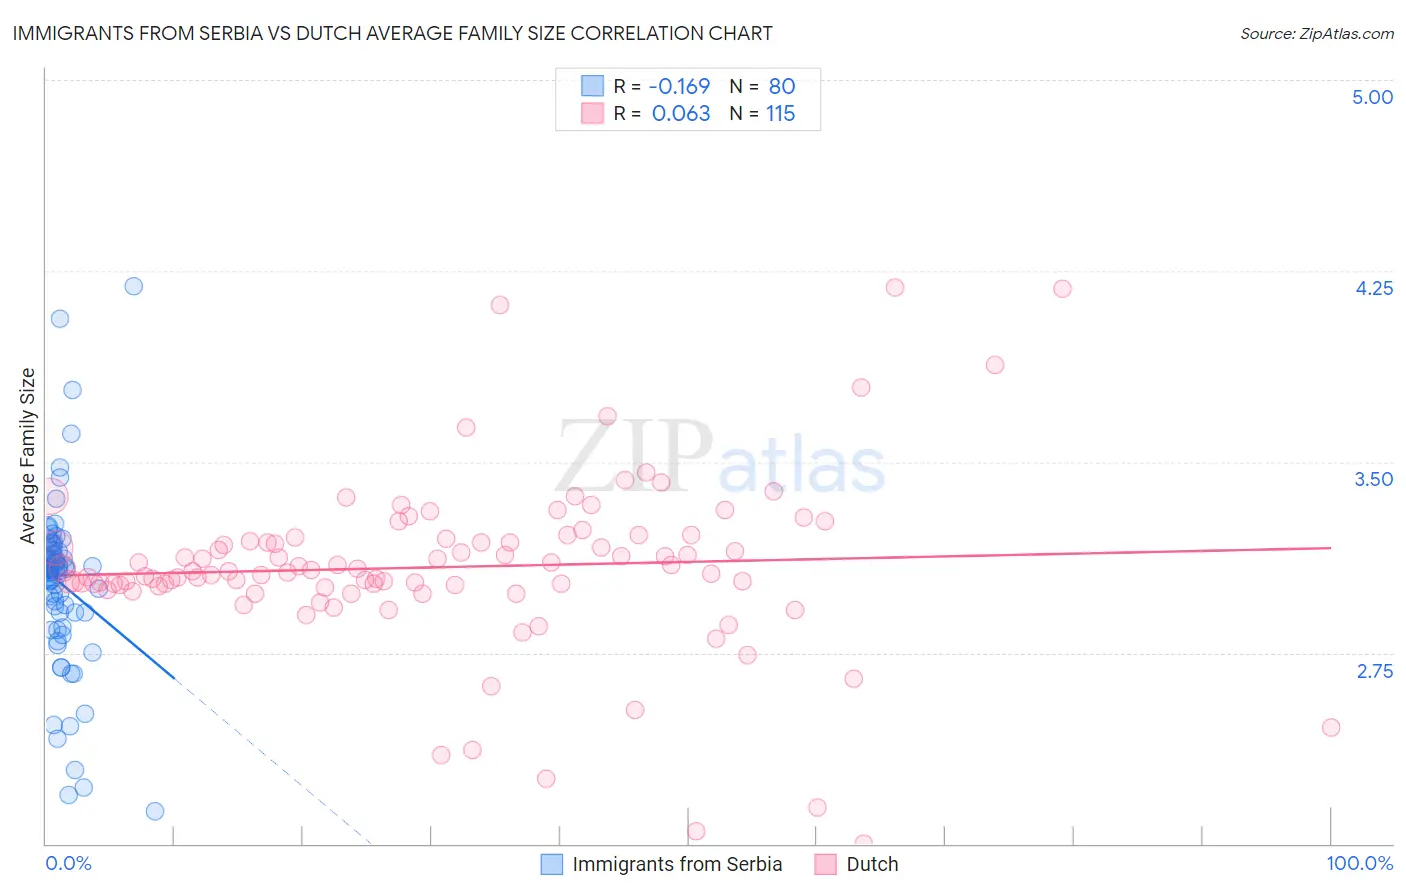
Immigrants from Serbia vs Dutch Average Family Size Correlation Chart
The statistical analysis conducted on geographies consisting of 131,725,495 people shows a poor negative correlation between the proportion of Immigrants from Serbia and average family size in the United States with a correlation coefficient (R) of -0.169 and weighted average of 3.13. Similarly, the statistical analysis conducted on geographies consisting of 553,876,215 people shows a slight positive correlation between the proportion of Dutch and average family size in the United States with a correlation coefficient (R) of 0.063 and weighted average of 3.11, a difference of 0.68%.
Average Family Size Correlation Summary
| Measurement | Immigrants from Serbia | Dutch |
| Minimum | 2.13 | 2.00 |
| Maximum | 4.19 | 4.19 |
| Range | 2.06 | 2.19 |
| Mean | 3.02 | 3.09 |
| Median | 3.08 | 3.07 |
| Interquartile 25% (IQ1) | 2.91 | 3.01 |
| Interquartile 75% (IQ3) | 3.15 | 3.20 |
| Interquartile Range (IQR) | 0.24 | 0.19 |
| Standard Deviation (Sample) | 0.34 | 0.34 |
| Standard Deviation (Population) | 0.34 | 0.34 |
Demographics Similar to Immigrants from Serbia and Dutch by Average Family Size
In terms of average family size, the demographic groups most similar to Immigrants from Serbia are Slavic (3.13, a difference of 0.050%), Northern European (3.13, a difference of 0.060%), Czechoslovakian (3.13, a difference of 0.080%), Immigrants from Northern Europe (3.13, a difference of 0.12%), and Immigrants from Australia (3.13, a difference of 0.14%). Similarly, the demographic groups most similar to Dutch are Ottawa (3.11, a difference of 0.010%), English (3.11, a difference of 0.060%), Celtic (3.11, a difference of 0.10%), Soviet Union (3.11, a difference of 0.18%), and Immigrants from Austria (3.12, a difference of 0.21%).
| Demographics | Rating | Rank | Average Family Size |
| Immigrants | Serbia | 0.1 /100 | #307 | Tragic 3.13 |
| Slavs | 0.1 /100 | #308 | Tragic 3.13 |
| Northern Europeans | 0.1 /100 | #309 | Tragic 3.13 |
| Czechoslovakians | 0.1 /100 | #310 | Tragic 3.13 |
| Immigrants | Northern Europe | 0.1 /100 | #311 | Tragic 3.13 |
| Immigrants | Australia | 0.1 /100 | #312 | Tragic 3.13 |
| Bulgarians | 0.1 /100 | #313 | Tragic 3.13 |
| Russians | 0.1 /100 | #314 | Tragic 3.12 |
| Immigrants | Scotland | 0.1 /100 | #315 | Tragic 3.12 |
| Serbians | 0.1 /100 | #316 | Tragic 3.12 |
| Italians | 0.1 /100 | #317 | Tragic 3.12 |
| Eastern Europeans | 0.1 /100 | #318 | Tragic 3.12 |
| Welsh | 0.1 /100 | #319 | Tragic 3.12 |
| Immigrants | North America | 0.0 /100 | #320 | Tragic 3.12 |
| Immigrants | Austria | 0.0 /100 | #321 | Tragic 3.12 |
| Immigrants | Canada | 0.0 /100 | #322 | Tragic 3.12 |
| Soviet Union | 0.0 /100 | #323 | Tragic 3.11 |
| Celtics | 0.0 /100 | #324 | Tragic 3.11 |
| English | 0.0 /100 | #325 | Tragic 3.11 |
| Ottawa | 0.0 /100 | #326 | Tragic 3.11 |
| Dutch | 0.0 /100 | #327 | Tragic 3.11 |