Immigrants from Moldova vs Jamaican Currently Married
COMPARE
Immigrants from Moldova
Jamaican
Currently Married
Currently Married Comparison
Immigrants from Moldova
Jamaicans
48.5%
CURRENTLY MARRIED
98.7/ 100
METRIC RATING
54th/ 347
METRIC RANK
41.4%
CURRENTLY MARRIED
0.0/ 100
METRIC RATING
313th/ 347
METRIC RANK
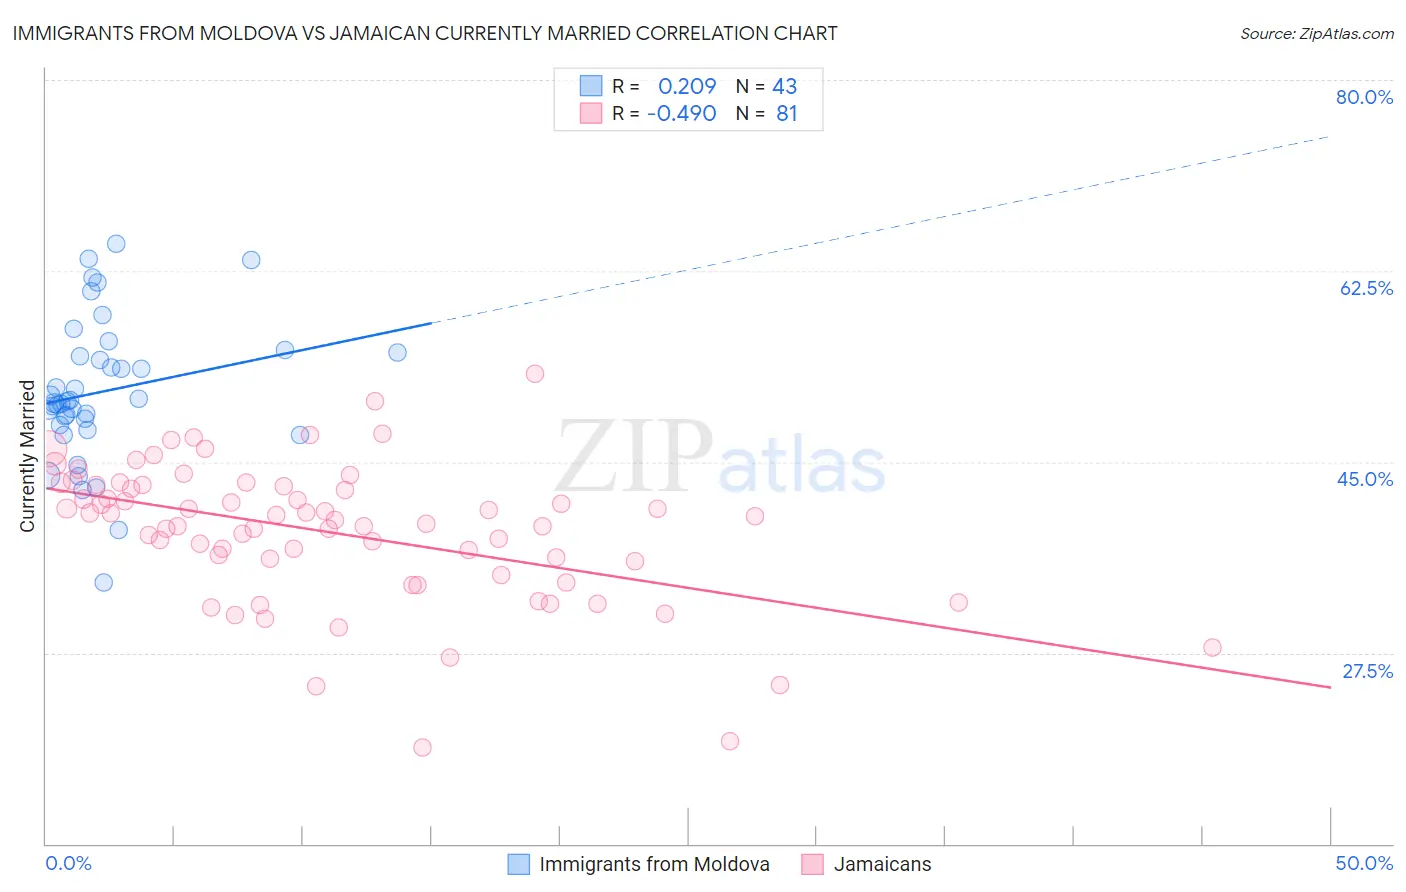
Immigrants from Moldova vs Jamaican Currently Married Correlation Chart
The statistical analysis conducted on geographies consisting of 124,399,411 people shows a weak positive correlation between the proportion of Immigrants from Moldova and percentage of population currently married in the United States with a correlation coefficient (R) of 0.209 and weighted average of 48.5%. Similarly, the statistical analysis conducted on geographies consisting of 368,004,365 people shows a moderate negative correlation between the proportion of Jamaicans and percentage of population currently married in the United States with a correlation coefficient (R) of -0.490 and weighted average of 41.4%, a difference of 17.2%.
Currently Married Correlation Summary
| Measurement | Immigrants from Moldova | Jamaican |
| Minimum | 33.9% | 18.8% |
| Maximum | 65.0% | 53.1% |
| Range | 31.1% | 34.3% |
| Mean | 51.5% | 38.5% |
| Median | 50.6% | 39.6% |
| Interquartile 25% (IQ1) | 48.4% | 35.2% |
| Interquartile 75% (IQ3) | 55.0% | 42.9% |
| Interquartile Range (IQR) | 6.6% | 7.6% |
| Standard Deviation (Sample) | 6.6% | 6.4% |
| Standard Deviation (Population) | 6.5% | 6.4% |
Similar Demographics by Currently Married
Demographics Similar to Immigrants from Moldova by Currently Married
In terms of currently married, the demographic groups most similar to Immigrants from Moldova are Immigrants from North Macedonia (48.5%, a difference of 0.0%), Latvian (48.5%, a difference of 0.0%), Immigrants from Netherlands (48.5%, a difference of 0.030%), Immigrants from Austria (48.5%, a difference of 0.060%), and French (48.4%, a difference of 0.080%).
| Demographics | Rating | Rank | Currently Married |
| Northern Europeans | 99.2 /100 | #47 | Exceptional 48.7% |
| Austrians | 99.2 /100 | #48 | Exceptional 48.7% |
| Bhutanese | 99.1 /100 | #49 | Exceptional 48.6% |
| Iranians | 99.0 /100 | #50 | Exceptional 48.6% |
| Whites/Caucasians | 99.0 /100 | #51 | Exceptional 48.6% |
| Russians | 98.9 /100 | #52 | Exceptional 48.6% |
| Immigrants | Austria | 98.8 /100 | #53 | Exceptional 48.5% |
| Immigrants | Moldova | 98.7 /100 | #54 | Exceptional 48.5% |
| Immigrants | North Macedonia | 98.7 /100 | #55 | Exceptional 48.5% |
| Latvians | 98.7 /100 | #56 | Exceptional 48.5% |
| Immigrants | Netherlands | 98.6 /100 | #57 | Exceptional 48.5% |
| French | 98.6 /100 | #58 | Exceptional 48.4% |
| Immigrants | Ireland | 98.5 /100 | #59 | Exceptional 48.4% |
| Immigrants | Romania | 98.5 /100 | #60 | Exceptional 48.4% |
| Romanians | 98.5 /100 | #61 | Exceptional 48.4% |
Demographics Similar to Jamaicans by Currently Married
In terms of currently married, the demographic groups most similar to Jamaicans are West Indian (41.3%, a difference of 0.080%), Inupiat (41.3%, a difference of 0.16%), Immigrants from Caribbean (41.3%, a difference of 0.22%), Haitian (41.3%, a difference of 0.24%), and Somali (41.5%, a difference of 0.29%).
| Demographics | Rating | Rank | Currently Married |
| Immigrants | Guyana | 0.0 /100 | #306 | Tragic 41.9% |
| Africans | 0.0 /100 | #307 | Tragic 41.8% |
| Immigrants | Belize | 0.0 /100 | #308 | Tragic 41.8% |
| Immigrants | Liberia | 0.0 /100 | #309 | Tragic 41.8% |
| Guyanese | 0.0 /100 | #310 | Tragic 41.6% |
| Trinidadians and Tobagonians | 0.0 /100 | #311 | Tragic 41.5% |
| Somalis | 0.0 /100 | #312 | Tragic 41.5% |
| Jamaicans | 0.0 /100 | #313 | Tragic 41.4% |
| West Indians | 0.0 /100 | #314 | Tragic 41.3% |
| Inupiat | 0.0 /100 | #315 | Tragic 41.3% |
| Immigrants | Caribbean | 0.0 /100 | #316 | Tragic 41.3% |
| Haitians | 0.0 /100 | #317 | Tragic 41.3% |
| Bahamians | 0.0 /100 | #318 | Tragic 41.2% |
| Immigrants | Somalia | 0.0 /100 | #319 | Tragic 41.2% |
| Immigrants | Jamaica | 0.0 /100 | #320 | Tragic 41.1% |