Immigrants from Micronesia vs Immigrants from Somalia Single Father Households
COMPARE
Immigrants from Micronesia
Immigrants from Somalia
Single Father Households
Single Father Households Comparison
Immigrants from Micronesia
Immigrants from Somalia
2.6%
SINGLE FATHER HOUSEHOLDS
0.5/ 100
METRIC RATING
265th/ 347
METRIC RANK
2.5%
SINGLE FATHER HOUSEHOLDS
1.9/ 100
METRIC RATING
253rd/ 347
METRIC RANK
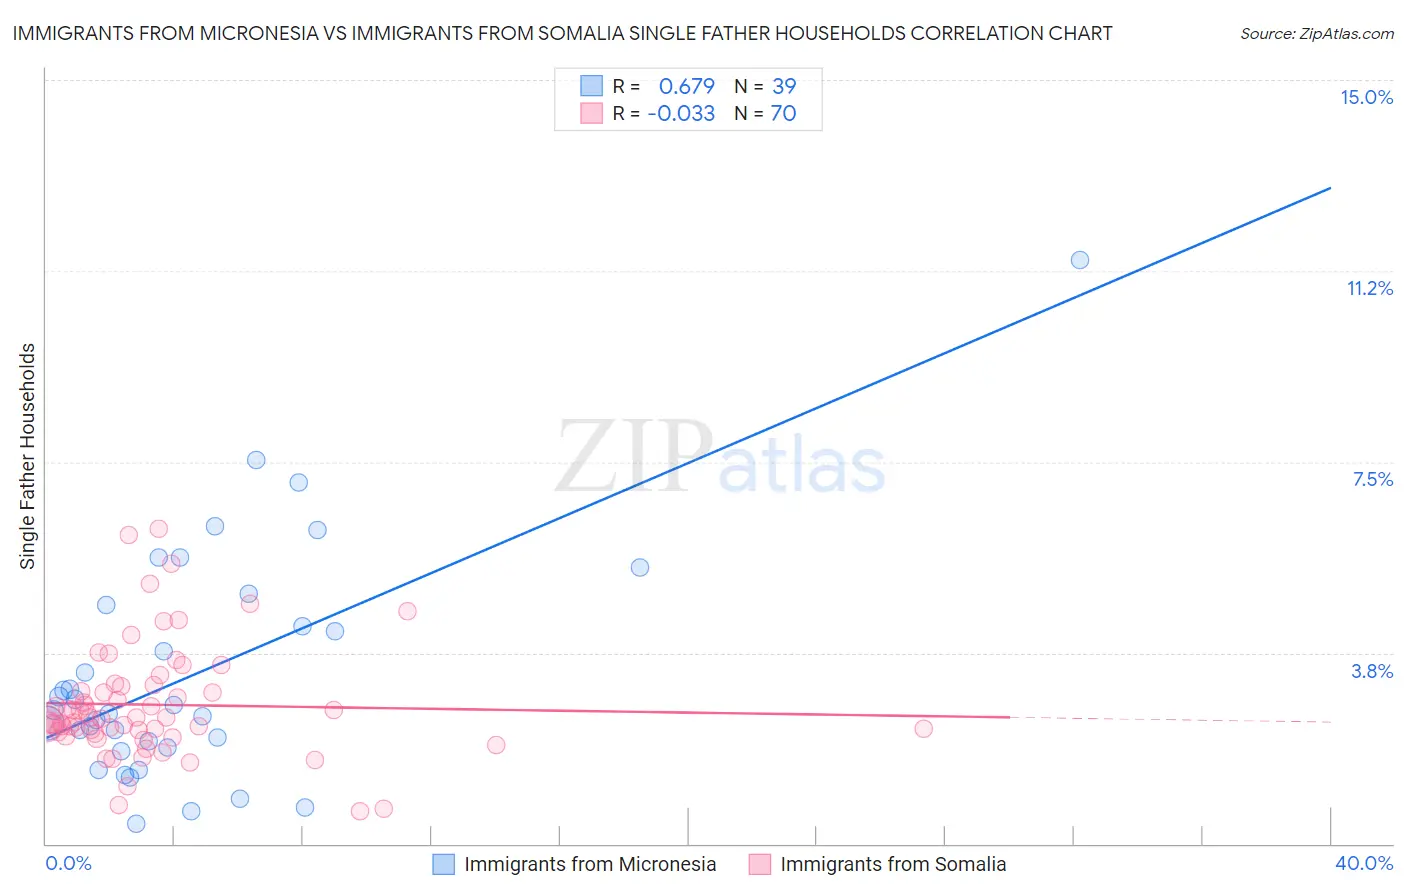
Immigrants from Micronesia vs Immigrants from Somalia Single Father Households Correlation Chart
The statistical analysis conducted on geographies consisting of 61,525,430 people shows a significant positive correlation between the proportion of Immigrants from Micronesia and percentage of single father households in the United States with a correlation coefficient (R) of 0.679 and weighted average of 2.6%. Similarly, the statistical analysis conducted on geographies consisting of 91,982,855 people shows no correlation between the proportion of Immigrants from Somalia and percentage of single father households in the United States with a correlation coefficient (R) of -0.033 and weighted average of 2.5%, a difference of 2.3%.
Single Father Households Correlation Summary
| Measurement | Immigrants from Micronesia | Immigrants from Somalia |
| Minimum | 0.38% | 0.64% |
| Maximum | 11.5% | 6.2% |
| Range | 11.1% | 5.5% |
| Mean | 3.3% | 2.7% |
| Median | 2.6% | 2.5% |
| Interquartile 25% (IQ1) | 1.9% | 2.2% |
| Interquartile 75% (IQ3) | 4.7% | 3.1% |
| Interquartile Range (IQR) | 2.8% | 0.90% |
| Standard Deviation (Sample) | 2.3% | 1.1% |
| Standard Deviation (Population) | 2.2% | 1.1% |
Demographics Similar to Immigrants from Micronesia and Immigrants from Somalia by Single Father Households
In terms of single father households, the demographic groups most similar to Immigrants from Micronesia are French American Indian (2.6%, a difference of 0.040%), Indonesian (2.6%, a difference of 0.060%), Guamanian/Chamorro (2.6%, a difference of 0.52%), Haitian (2.6%, a difference of 0.56%), and Dominican (2.5%, a difference of 0.75%). Similarly, the demographic groups most similar to Immigrants from Somalia are Immigrants from Thailand (2.5%, a difference of 0.040%), Immigrants from Eritrea (2.5%, a difference of 0.070%), Liberian (2.5%, a difference of 0.090%), Somali (2.5%, a difference of 0.18%), and Immigrants from Cameroon (2.5%, a difference of 0.35%).
| Demographics | Rating | Rank | Single Father Households |
| Immigrants | Cameroon | 2.3 /100 | #249 | Tragic 2.5% |
| Somalis | 2.1 /100 | #250 | Tragic 2.5% |
| Liberians | 2.0 /100 | #251 | Tragic 2.5% |
| Immigrants | Eritrea | 2.0 /100 | #252 | Tragic 2.5% |
| Immigrants | Somalia | 1.9 /100 | #253 | Tragic 2.5% |
| Immigrants | Thailand | 1.8 /100 | #254 | Tragic 2.5% |
| Tongans | 1.5 /100 | #255 | Tragic 2.5% |
| Potawatomi | 1.4 /100 | #256 | Tragic 2.5% |
| Immigrants | Congo | 1.2 /100 | #257 | Tragic 2.5% |
| Spanish | 1.1 /100 | #258 | Tragic 2.5% |
| Comanche | 1.0 /100 | #259 | Tragic 2.5% |
| Immigrants | Caribbean | 1.0 /100 | #260 | Tragic 2.5% |
| Immigrants | Belize | 0.9 /100 | #261 | Tragic 2.5% |
| Immigrants | Liberia | 0.8 /100 | #262 | Tragic 2.5% |
| Dominicans | 0.8 /100 | #263 | Tragic 2.5% |
| Indonesians | 0.5 /100 | #264 | Tragic 2.6% |
| Immigrants | Micronesia | 0.5 /100 | #265 | Tragic 2.6% |
| French American Indians | 0.5 /100 | #266 | Tragic 2.6% |
| Guamanians/Chamorros | 0.4 /100 | #267 | Tragic 2.6% |
| Haitians | 0.4 /100 | #268 | Tragic 2.6% |
| Cubans | 0.3 /100 | #269 | Tragic 2.6% |