Immigrants from Mexico vs Immigrants from Morocco Births to Unmarried Women

COMPARE

Immigrants from Mexico
Race
Ancestry
AfghanAfricanAlaska NativeAlaskan AthabascanAlbanianAleutAlsatianAmericanApacheArabArapahoArgentineanArmenianAssyrian/Chaldean/SyriacAustralianAustrianBahamianBangladeshiBarbadianBasqueBelgianBelizeanBermudanBhutaneseBlackfeetBolivianBrazilianBritishBritish West IndianBulgarianBurmeseCajunCambodianCanadianCape VerdeanCarpatho RusynCelticCentral AmericanCentral American IndianCherokeeCheyenneChickasawChileanChineseChippewaChoctawColombianColvilleComancheCosta RicanCreeCreekCroatianCrowCubanCypriotCzechCzechoslovakianDanishDelawareDominicanDutchDutch West IndianEastern EuropeanEcuadorianEgyptianEnglishEstonianEthiopianEuropeanFijianFilipinoFinnishFrenchFrench American IndianFrench CanadianGermanGerman RussianGhanaianGreekGuamanian/ChamorroGuatemalanGuyaneseHaitianHmongHonduranHopiHoumaHungarianIcelanderIndian (Asian)IndonesianInupiatIranianIraqiIrishIroquoisIsraeliItalianJamaicanJapaneseJordanianKenyanKiowaKoreanLaotianLatvianLebaneseLiberianLithuanianLumbeeLuxembourgerMacedonianMalaysianMalteseMarshalleseMenomineeMexicanMexican American IndianMongolianMoroccanNative HawaiianNavajoNepaleseNew ZealanderNicaraguanNigerianNorthern EuropeanNorwegianOkinawanOsageOttawaPaiutePakistaniPalestinianPanamanianParaguayanPennsylvania GermanPeruvianPimaPolishPortuguesePotawatomiPuebloPuerto RicanPuget Sound SalishRomanianRussianSalvadoranSamoanScandinavianScotch-IrishScottishSeminoleSenegaleseSerbianShoshoneSierra LeoneanSiouxSlavicSlovakSloveneSomaliSouth AfricanSouth AmericanSouth American IndianSoviet UnionSpaniardSpanishSpanish AmericanSpanish American IndianSri LankanSubsaharan AfricanSudaneseSwedishSwissSyrianTaiwaneseThaiTlingit-HaidaTohono O'OdhamTonganTrinidadian and TobagonianTsimshianTurkishU.S. Virgin IslanderUgandanUkrainianUruguayanUteVenezuelanVietnameseWelshWest IndianYakamaYaquiYugoslavianYumanYup'ikZimbabwean
Immigration
NonimmigrantsImmigrantsAfghanistanAfricaAlbaniaArgentinaArmeniaAsiaAustraliaAustriaBahamasBangladeshBarbadosBelarusBelgiumBelizeBoliviaBosnia and HerzegovinaBrazilBulgariaBurma/MyanmarCabo VerdeCambodiaCameroonCanadaCaribbeanCentral AmericaChileChinaColombiaCongoCosta RicaCroatiaCubaCzechoslovakiaDenmarkDominicaDominican RepublicEastern AfricaEastern AsiaEastern EuropeEcuadorEgyptEl SalvadorEnglandEritreaEthiopiaEuropeFijiFranceGermanyGhanaGreeceGrenadaGuatemalaGuyanaHaitiHondurasHong KongHungaryIndiaIndonesiaIranIraqIrelandIsraelItalyJamaicaJapanJordanKazakhstanKenyaKoreaKuwaitLaosLatin AmericaLatviaLebanonLiberiaLithuaniaMalaysiaMexicoMicronesiaMiddle AfricaMoldovaNepalNetherlandsNicaraguaNigeriaNorth AmericaNorth MacedoniaNorthern AfricaNorthern EuropeNorwayOceaniaPakistanPanamaPeruPhilippinesPolandPortugalRomaniaRussiaSaudi ArabiaScotlandSenegalSerbiaSierra LeoneSingaporeSomaliaSouth AfricaSouth AmericaSouth Central AsiaSouth Eastern AsiaSouthern EuropeSpainSri LankaSt. Vincent and the GrenadinesSudanSwedenSwitzerlandSyriaTaiwanThailandTrinidad and TobagoTurkeyUgandaUkraineUruguayUzbekistanVenezuelaVietnamWest IndiesWestern AfricaWestern AsiaWestern EuropeYemenZaireZimbabweAzores
Immigrants from Morocco
Race
Ancestry
AfghanAfricanAlaska NativeAlaskan AthabascanAlbanianAleutAlsatianAmericanApacheArabArapahoArgentineanArmenianAssyrian/Chaldean/SyriacAustralianAustrianBahamianBangladeshiBarbadianBasqueBelgianBelizeanBermudanBhutaneseBlackfeetBolivianBrazilianBritishBritish West IndianBulgarianBurmeseCajunCambodianCanadianCape VerdeanCarpatho RusynCelticCentral AmericanCentral American IndianCherokeeCheyenneChickasawChileanChineseChippewaChoctawColombianColvilleComancheCosta RicanCreeCreekCroatianCrowCubanCypriotCzechCzechoslovakianDanishDelawareDominicanDutchDutch West IndianEastern EuropeanEcuadorianEgyptianEnglishEstonianEthiopianEuropeanFijianFilipinoFinnishFrenchFrench American IndianFrench CanadianGermanGerman RussianGhanaianGreekGuamanian/ChamorroGuatemalanGuyaneseHaitianHmongHonduranHopiHoumaHungarianIcelanderIndian (Asian)IndonesianInupiatIranianIraqiIrishIroquoisIsraeliItalianJamaicanJapaneseJordanianKenyanKiowaKoreanLaotianLatvianLebaneseLiberianLithuanianLumbeeLuxembourgerMacedonianMalaysianMalteseMarshalleseMenomineeMexicanMexican American IndianMongolianMoroccanNative HawaiianNavajoNepaleseNew ZealanderNicaraguanNigerianNorthern EuropeanNorwegianOkinawanOsageOttawaPaiutePakistaniPalestinianPanamanianParaguayanPennsylvania GermanPeruvianPimaPolishPortuguesePotawatomiPuebloPuerto RicanPuget Sound SalishRomanianRussianSalvadoranSamoanScandinavianScotch-IrishScottishSeminoleSenegaleseSerbianShoshoneSierra LeoneanSiouxSlavicSlovakSloveneSomaliSouth AfricanSouth AmericanSouth American IndianSoviet UnionSpaniardSpanishSpanish AmericanSpanish American IndianSri LankanSubsaharan AfricanSudaneseSwedishSwissSyrianTaiwaneseThaiTlingit-HaidaTohono O'OdhamTonganTrinidadian and TobagonianTsimshianTurkishU.S. Virgin IslanderUgandanUkrainianUruguayanUteVenezuelanVietnameseWelshWest IndianYakamaYaquiYugoslavianYumanYup'ikZimbabwean
Immigration
NonimmigrantsImmigrantsAfghanistanAfricaAlbaniaArgentinaArmeniaAsiaAustraliaAustriaBahamasBangladeshBarbadosBelarusBelgiumBelizeBoliviaBosnia and HerzegovinaBrazilBulgariaBurma/MyanmarCabo VerdeCambodiaCameroonCanadaCaribbeanCentral AmericaChileChinaColombiaCongoCosta RicaCroatiaCubaCzechoslovakiaDenmarkDominicaDominican RepublicEastern AfricaEastern AsiaEastern EuropeEcuadorEgyptEl SalvadorEnglandEritreaEthiopiaEuropeFijiFranceGermanyGhanaGreeceGrenadaGuatemalaGuyanaHaitiHondurasHong KongHungaryIndiaIndonesiaIranIraqIrelandIsraelItalyJamaicaJapanJordanKazakhstanKenyaKoreaKuwaitLaosLatin AmericaLatviaLebanonLiberiaLithuaniaMalaysiaMicronesiaMiddle AfricaMoldovaMoroccoNepalNetherlandsNicaraguaNigeriaNorth AmericaNorth MacedoniaNorthern AfricaNorthern EuropeNorwayOceaniaPakistanPanamaPeruPhilippinesPolandPortugalRomaniaRussiaSaudi ArabiaScotlandSenegalSerbiaSierra LeoneSingaporeSomaliaSouth AfricaSouth AmericaSouth Central AsiaSouth Eastern AsiaSouthern EuropeSpainSri LankaSt. Vincent and the GrenadinesSudanSwedenSwitzerlandSyriaTaiwanThailandTrinidad and TobagoTurkeyUgandaUkraineUruguayUzbekistanVenezuelaVietnamWest IndiesWestern AfricaWestern AsiaWestern EuropeYemenZaireZimbabweAzores
Births to Unmarried Women
Income
Poverty
Unemployment
Labor Participation
Family Structure
Vehicle Availability
Education Level
Disability

Births to Unmarried Women Comparison

Immigrants from Mexico

Immigrants from Morocco

Tragic
Excellent
37.5%
BIRTHS TO UNMARRIED WOMEN
0.0/ 100
METRIC RATING
285th/ 347
METRIC RANK
30.4%
BIRTHS TO UNMARRIED WOMEN
85.2/ 100
METRIC RATING
133rd/ 347
METRIC RANK

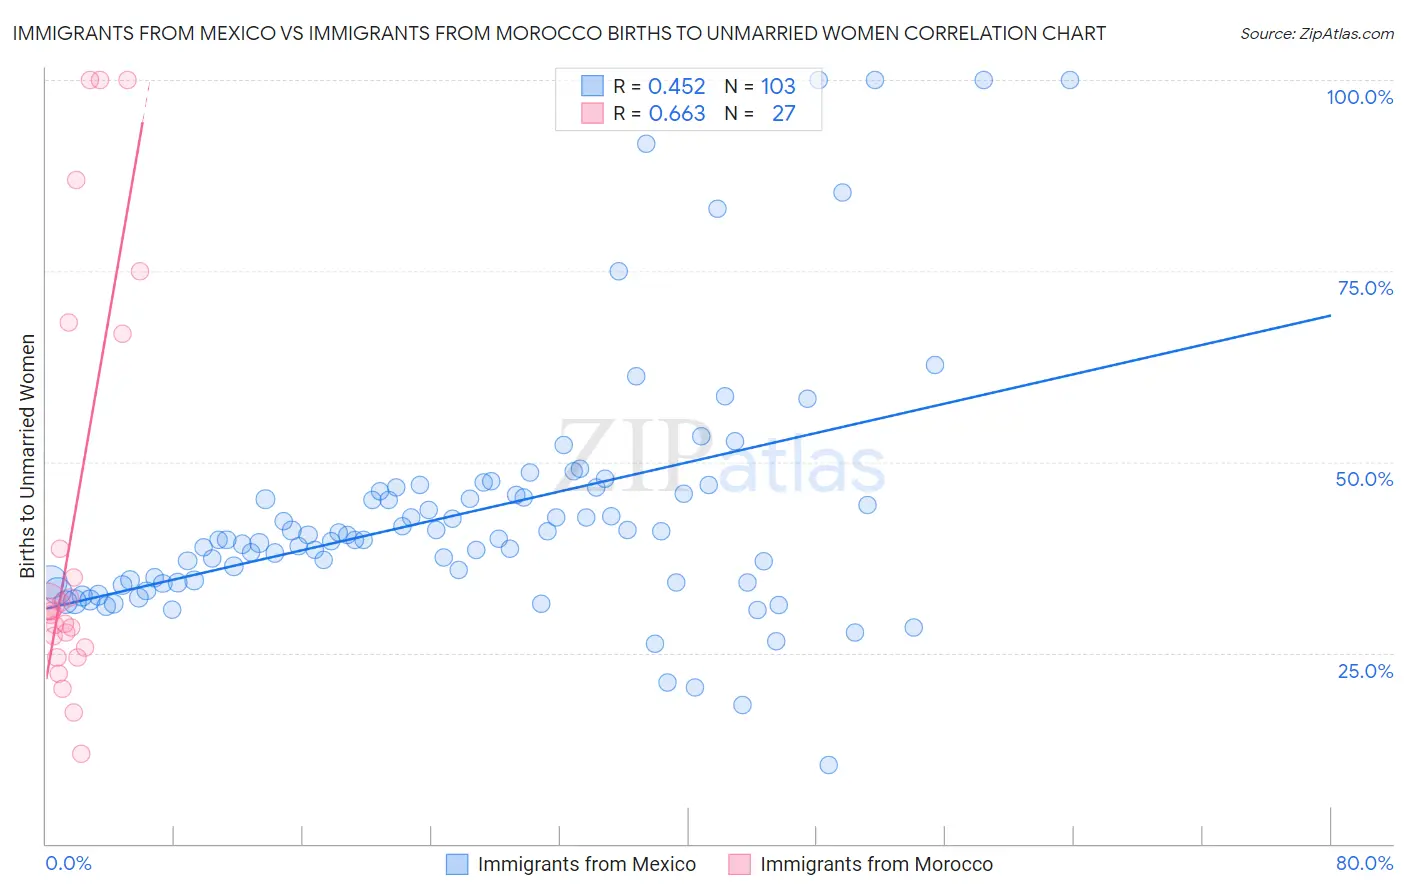
Immigrants from Mexico vs Immigrants from Morocco Births to Unmarried Women Correlation Chart

The statistical analysis conducted on geographies consisting of 469,807,529 people shows a moderate positive correlation between the proportion of Immigrants from Mexico and percentage of births to unmarried women in the United States with a correlation coefficient (R) of 0.452 and weighted average of 37.5%. Similarly, the statistical analysis conducted on geographies consisting of 172,654,004 people shows a significant positive correlation between the proportion of Immigrants from Morocco and percentage of births to unmarried women in the United States with a correlation coefficient (R) of 0.663 and weighted average of 30.4%, a difference of 23.4%.
Immigrants from Mexico vs Immigrants from Morocco Births to Unmarried Women

Births to Unmarried Women Correlation Summary

MeasurementImmigrants from MexicoImmigrants from Morocco
Minimum10.3%11.8%
Maximum100.0%100.0%
Range89.7%88.2%
Mean43.3%42.4%
Median39.8%30.4%
Interquartile 25% (IQ1)34.2%25.7%
Interquartile 75% (IQ3)46.2%66.7%
Interquartile Range (IQR)12.0%41.0%
Standard Deviation (Sample)16.6%27.4%
Standard Deviation (Population)16.5%26.9%

Similar Demographics by Births to Unmarried Women

Demographics Similar to Immigrants from Mexico by Births to Unmarried Women

In terms of births to unmarried women, the demographic groups most similar to Immigrants from Mexico are Immigrants from Guatemala (37.5%, a difference of 0.010%), Immigrants from Central America (37.4%, a difference of 0.10%), Spanish American Indian (37.4%, a difference of 0.16%), Liberian (37.4%, a difference of 0.24%), and Creek (37.6%, a difference of 0.25%).
DemographicsRating | RankBirths to Unmarried Women
Immigrants | Latin America
0.1
/100
|
#278
Tragic
37.1%
West Indians
0.1
/100
|
#279
Tragic
37.3%
Immigrants | St. Vincent and the Grenadines
0.1
/100
|
#280
Tragic
37.3%
Immigrants | Belize
0.1
/100
|
#281
Tragic
37.3%
Liberians
0.0
/100
|
#282
Tragic
37.4%
Spanish American Indians
0.0
/100
|
#283
Tragic
37.4%
Immigrants | Central America
0.0
/100
|
#284
Tragic
37.4%
Immigrants | Mexico
0.0
/100
|
#285
Tragic
37.5%
Immigrants | Guatemala
0.0
/100
|
#286
Tragic
37.5%
Creek
0.0
/100
|
#287
Tragic
37.6%
Immigrants | Liberia
0.0
/100
|
#288
Tragic
37.6%
Alaskan Athabascans
0.0
/100
|
#289
Tragic
37.7%
Hispanics or Latinos
0.0
/100
|
#290
Tragic
37.8%
Seminole
0.0
/100
|
#291
Tragic
37.9%
Blackfeet
0.0
/100
|
#292
Tragic
37.9%

Demographics Similar to Immigrants from Morocco by Births to Unmarried Women

In terms of births to unmarried women, the demographic groups most similar to Immigrants from Morocco are Immigrants from South Eastern Asia (30.4%, a difference of 0.010%), New Zealander (30.3%, a difference of 0.050%), Immigrants from Zimbabwe (30.3%, a difference of 0.080%), Brazilian (30.4%, a difference of 0.080%), and Immigrants from Bosnia and Herzegovina (30.3%, a difference of 0.090%).
DemographicsRating | RankBirths to Unmarried Women
Europeans
87.2
/100
|
#126
Excellent
30.2%
Chinese
87.1
/100
|
#127
Excellent
30.2%
Icelanders
86.0
/100
|
#128
Excellent
30.3%
Immigrants | Spain
85.8
/100
|
#129
Excellent
30.3%
Immigrants | Bosnia and Herzegovina
85.7
/100
|
#130
Excellent
30.3%
Immigrants | Zimbabwe
85.7
/100
|
#131
Excellent
30.3%
New Zealanders
85.5
/100
|
#132
Excellent
30.3%
Immigrants | Morocco
85.2
/100
|
#133
Excellent
30.4%
Immigrants | South Eastern Asia
85.2
/100
|
#134
Excellent
30.4%
Brazilians
84.8
/100
|
#135
Excellent
30.4%
Immigrants | Scotland
84.6
/100
|
#136
Excellent
30.4%
Immigrants | Philippines
83.9
/100
|
#137
Excellent
30.4%
Puget Sound Salish
83.9
/100
|
#138
Excellent
30.4%
Immigrants | Canada
83.7
/100
|
#139
Excellent
30.4%
Swiss
83.1
/100
|
#140
Excellent
30.5%