Immigrants from Mexico vs Immigrants from Jamaica Births to Unmarried Women
COMPARE
Immigrants from Mexico
Immigrants from Jamaica
Births to Unmarried Women
Births to Unmarried Women Comparison
Immigrants from Mexico
Immigrants from Jamaica
37.5%
BIRTHS TO UNMARRIED WOMEN
0.0/ 100
METRIC RATING
285th/ 347
METRIC RANK
38.8%
BIRTHS TO UNMARRIED WOMEN
0.0/ 100
METRIC RATING
303rd/ 347
METRIC RANK
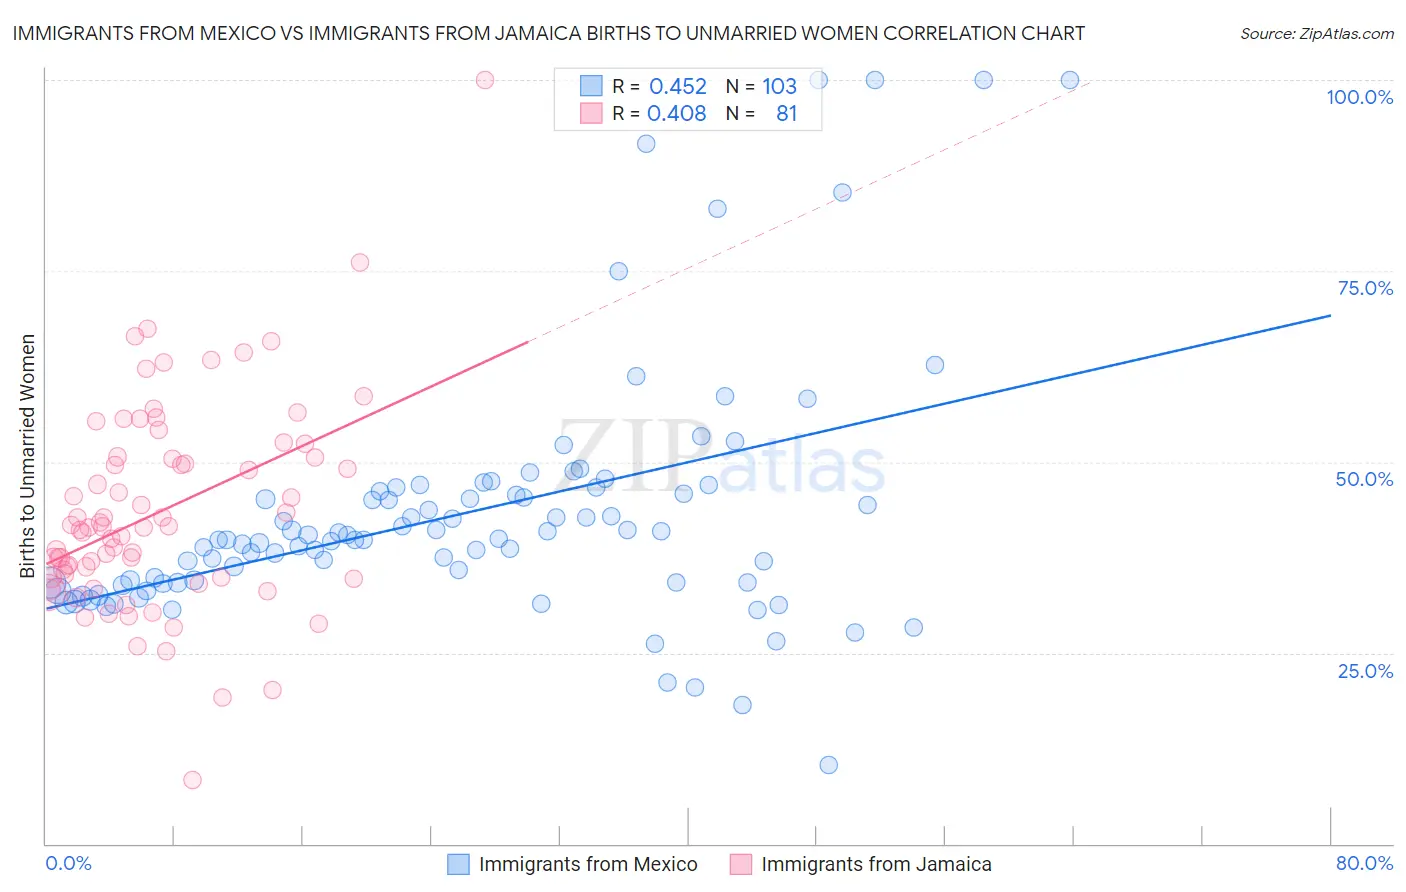
Immigrants from Mexico vs Immigrants from Jamaica Births to Unmarried Women Correlation Chart
The statistical analysis conducted on geographies consisting of 469,807,529 people shows a moderate positive correlation between the proportion of Immigrants from Mexico and percentage of births to unmarried women in the United States with a correlation coefficient (R) of 0.452 and weighted average of 37.5%. Similarly, the statistical analysis conducted on geographies consisting of 287,311,689 people shows a moderate positive correlation between the proportion of Immigrants from Jamaica and percentage of births to unmarried women in the United States with a correlation coefficient (R) of 0.408 and weighted average of 38.8%, a difference of 3.5%.
Births to Unmarried Women Correlation Summary
| Measurement | Immigrants from Mexico | Immigrants from Jamaica |
| Minimum | 10.3% | 8.3% |
| Maximum | 100.0% | 100.0% |
| Range | 89.7% | 91.7% |
| Mean | 43.3% | 43.5% |
| Median | 39.8% | 41.4% |
| Interquartile 25% (IQ1) | 34.2% | 34.8% |
| Interquartile 75% (IQ3) | 46.2% | 50.6% |
| Interquartile Range (IQR) | 12.0% | 15.8% |
| Standard Deviation (Sample) | 16.6% | 13.7% |
| Standard Deviation (Population) | 16.5% | 13.6% |
Demographics Similar to Immigrants from Mexico and Immigrants from Jamaica by Births to Unmarried Women
In terms of births to unmarried women, the demographic groups most similar to Immigrants from Mexico are Immigrants from Guatemala (37.5%, a difference of 0.010%), Immigrants from Central America (37.4%, a difference of 0.10%), Creek (37.6%, a difference of 0.25%), Immigrants from Liberia (37.6%, a difference of 0.41%), and Alaskan Athabascan (37.7%, a difference of 0.65%). Similarly, the demographic groups most similar to Immigrants from Jamaica are Yaqui (38.8%, a difference of 0.050%), Honduran (38.7%, a difference of 0.32%), Haitian (38.6%, a difference of 0.56%), Immigrants from West Indies (38.6%, a difference of 0.57%), and Spanish American (38.6%, a difference of 0.63%).
| Demographics | Rating | Rank | Births to Unmarried Women |
| Immigrants | Central America | 0.0 /100 | #284 | Tragic 37.4% |
| Immigrants | Mexico | 0.0 /100 | #285 | Tragic 37.5% |
| Immigrants | Guatemala | 0.0 /100 | #286 | Tragic 37.5% |
| Creek | 0.0 /100 | #287 | Tragic 37.6% |
| Immigrants | Liberia | 0.0 /100 | #288 | Tragic 37.6% |
| Alaskan Athabascans | 0.0 /100 | #289 | Tragic 37.7% |
| Hispanics or Latinos | 0.0 /100 | #290 | Tragic 37.8% |
| Seminole | 0.0 /100 | #291 | Tragic 37.9% |
| Blackfeet | 0.0 /100 | #292 | Tragic 37.9% |
| Immigrants | Nicaragua | 0.0 /100 | #293 | Tragic 38.0% |
| British West Indians | 0.0 /100 | #294 | Tragic 38.0% |
| Iroquois | 0.0 /100 | #295 | Tragic 38.2% |
| Alaska Natives | 0.0 /100 | #296 | Tragic 38.3% |
| Dutch West Indians | 0.0 /100 | #297 | Tragic 38.4% |
| Jamaicans | 0.0 /100 | #298 | Tragic 38.5% |
| Spanish Americans | 0.0 /100 | #299 | Tragic 38.6% |
| Immigrants | West Indies | 0.0 /100 | #300 | Tragic 38.6% |
| Haitians | 0.0 /100 | #301 | Tragic 38.6% |
| Hondurans | 0.0 /100 | #302 | Tragic 38.7% |
| Immigrants | Jamaica | 0.0 /100 | #303 | Tragic 38.8% |
| Yaqui | 0.0 /100 | #304 | Tragic 38.8% |