Immigrants from Lithuania vs Native/Alaskan Family Households with Children
COMPARE
Immigrants from Lithuania
Native/Alaskan
Family Households with Children
Family Households with Children Comparison
Immigrants from Lithuania
Natives/Alaskans
26.8%
FAMILY HOUSEHOLDS WITH CHILDREN
1.2/ 100
METRIC RATING
259th/ 347
METRIC RANK
28.4%
FAMILY HOUSEHOLDS WITH CHILDREN
99.8/ 100
METRIC RATING
80th/ 347
METRIC RANK
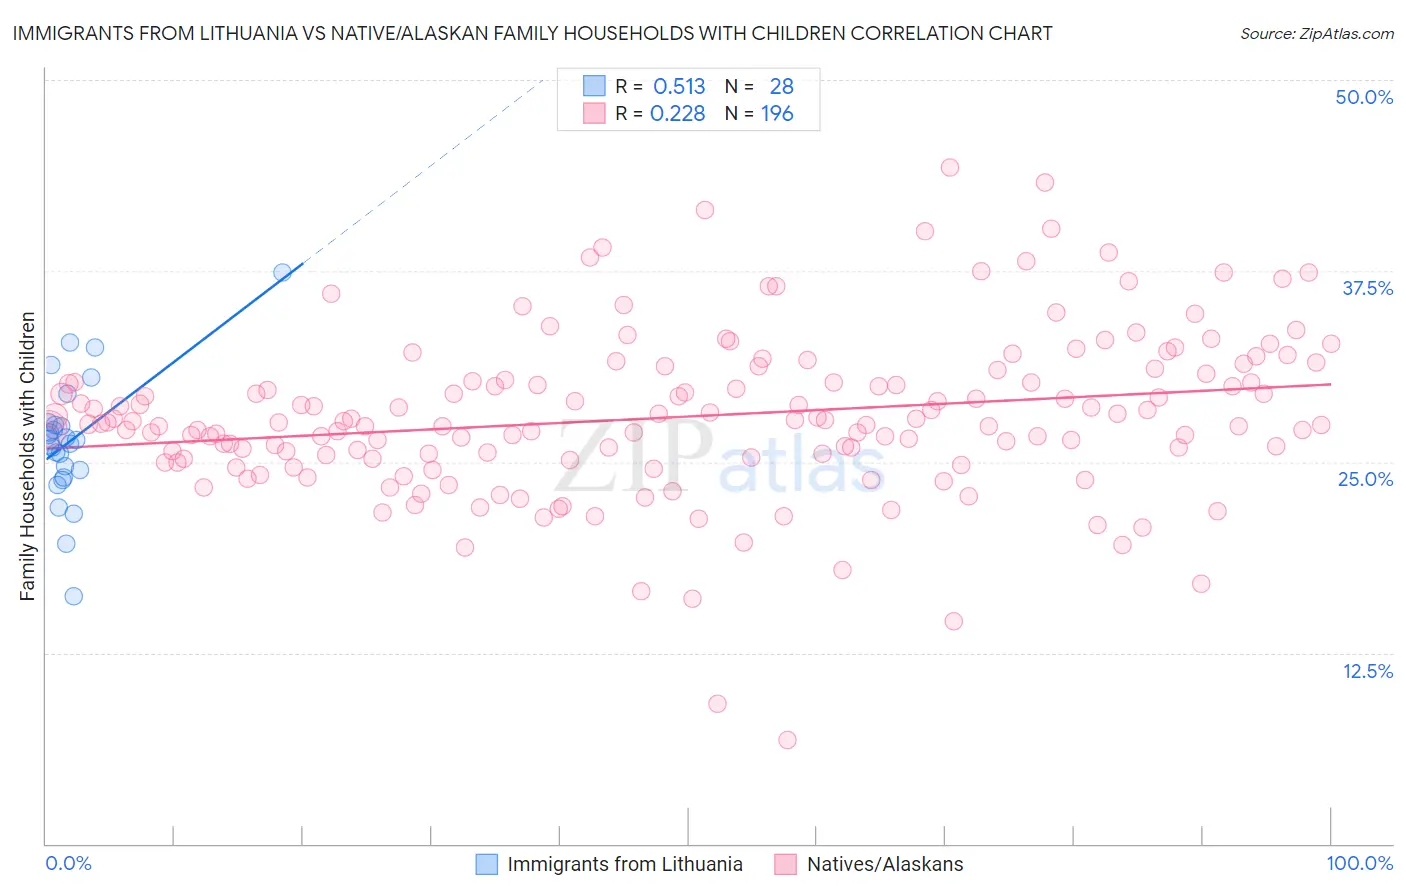
Immigrants from Lithuania vs Native/Alaskan Family Households with Children Correlation Chart
The statistical analysis conducted on geographies consisting of 117,683,202 people shows a substantial positive correlation between the proportion of Immigrants from Lithuania and percentage of family households with children in the United States with a correlation coefficient (R) of 0.513 and weighted average of 26.8%. Similarly, the statistical analysis conducted on geographies consisting of 512,450,459 people shows a weak positive correlation between the proportion of Natives/Alaskans and percentage of family households with children in the United States with a correlation coefficient (R) of 0.228 and weighted average of 28.4%, a difference of 6.0%.
Family Households with Children Correlation Summary
| Measurement | Immigrants from Lithuania | Native/Alaskan |
| Minimum | 16.2% | 6.8% |
| Maximum | 37.4% | 44.2% |
| Range | 21.2% | 37.4% |
| Mean | 26.4% | 28.0% |
| Median | 26.4% | 27.6% |
| Interquartile 25% (IQ1) | 24.3% | 25.2% |
| Interquartile 75% (IQ3) | 27.5% | 30.3% |
| Interquartile Range (IQR) | 3.3% | 5.1% |
| Standard Deviation (Sample) | 4.2% | 5.4% |
| Standard Deviation (Population) | 4.1% | 5.4% |
Similar Demographics by Family Households with Children
Demographics Similar to Immigrants from Lithuania by Family Households with Children
In terms of family households with children, the demographic groups most similar to Immigrants from Lithuania are Immigrants from Jamaica (26.8%, a difference of 0.020%), Immigrants from Cuba (26.8%, a difference of 0.030%), Slavic (26.8%, a difference of 0.040%), Immigrants from Belarus (26.8%, a difference of 0.070%), and Scotch-Irish (26.8%, a difference of 0.080%).
| Demographics | Rating | Rank | Family Households with Children |
| Irish | 1.8 /100 | #252 | Tragic 26.8% |
| Italians | 1.5 /100 | #253 | Tragic 26.8% |
| Immigrants | Scotland | 1.5 /100 | #254 | Tragic 26.8% |
| German Russians | 1.5 /100 | #255 | Tragic 26.8% |
| Scotch-Irish | 1.4 /100 | #256 | Tragic 26.8% |
| Slavs | 1.3 /100 | #257 | Tragic 26.8% |
| Immigrants | Cuba | 1.3 /100 | #258 | Tragic 26.8% |
| Immigrants | Lithuania | 1.2 /100 | #259 | Tragic 26.8% |
| Immigrants | Jamaica | 1.2 /100 | #260 | Tragic 26.8% |
| Immigrants | Belarus | 1.1 /100 | #261 | Tragic 26.8% |
| Immigrants | Russia | 1.0 /100 | #262 | Tragic 26.8% |
| Immigrants | North Macedonia | 1.0 /100 | #263 | Tragic 26.7% |
| Taiwanese | 0.9 /100 | #264 | Tragic 26.7% |
| Chippewa | 0.9 /100 | #265 | Tragic 26.7% |
| Maltese | 0.9 /100 | #266 | Tragic 26.7% |
Demographics Similar to Natives/Alaskans by Family Households with Children
In terms of family households with children, the demographic groups most similar to Natives/Alaskans are Immigrants from Iraq (28.4%, a difference of 0.010%), South American (28.4%, a difference of 0.020%), Immigrants from Nepal (28.4%, a difference of 0.040%), Kenyan (28.4%, a difference of 0.070%), and Nigerian (28.4%, a difference of 0.080%).
| Demographics | Rating | Rank | Family Households with Children |
| Iraqis | 99.9 /100 | #73 | Exceptional 28.5% |
| Laotians | 99.9 /100 | #74 | Exceptional 28.5% |
| Immigrants | Jordan | 99.9 /100 | #75 | Exceptional 28.4% |
| Immigrants | Sri Lanka | 99.9 /100 | #76 | Exceptional 28.4% |
| Nigerians | 99.8 /100 | #77 | Exceptional 28.4% |
| Immigrants | Nepal | 99.8 /100 | #78 | Exceptional 28.4% |
| Immigrants | Iraq | 99.8 /100 | #79 | Exceptional 28.4% |
| Natives/Alaskans | 99.8 /100 | #80 | Exceptional 28.4% |
| South Americans | 99.8 /100 | #81 | Exceptional 28.4% |
| Kenyans | 99.8 /100 | #82 | Exceptional 28.4% |
| Nicaraguans | 99.8 /100 | #83 | Exceptional 28.4% |
| Costa Ricans | 99.8 /100 | #84 | Exceptional 28.4% |
| Immigrants | Syria | 99.8 /100 | #85 | Exceptional 28.4% |
| Immigrants | Western Africa | 99.6 /100 | #86 | Exceptional 28.3% |
| Colombians | 99.6 /100 | #87 | Exceptional 28.3% |