Immigrants from Lithuania vs Immigrants from Cameroon Family Households with Children
COMPARE
Immigrants from Lithuania
Immigrants from Cameroon
Family Households with Children
Family Households with Children Comparison
Immigrants from Lithuania
Immigrants from Cameroon
26.8%
FAMILY HOUSEHOLDS WITH CHILDREN
1.2/ 100
METRIC RATING
259th/ 347
METRIC RANK
29.2%
FAMILY HOUSEHOLDS WITH CHILDREN
100.0/ 100
METRIC RATING
37th/ 347
METRIC RANK
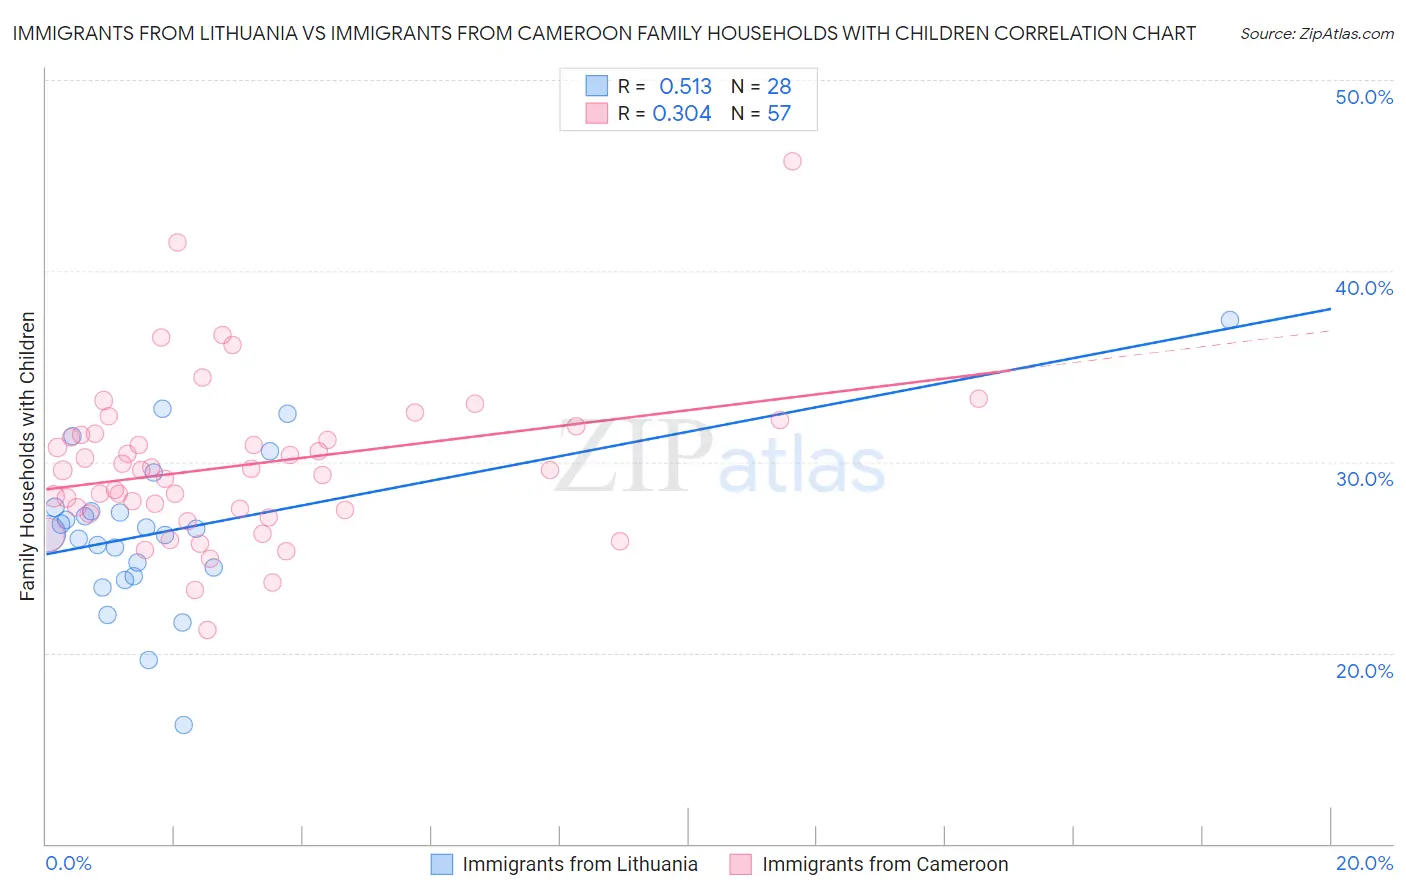
Immigrants from Lithuania vs Immigrants from Cameroon Family Households with Children Correlation Chart
The statistical analysis conducted on geographies consisting of 117,683,202 people shows a substantial positive correlation between the proportion of Immigrants from Lithuania and percentage of family households with children in the United States with a correlation coefficient (R) of 0.513 and weighted average of 26.8%. Similarly, the statistical analysis conducted on geographies consisting of 130,728,494 people shows a mild positive correlation between the proportion of Immigrants from Cameroon and percentage of family households with children in the United States with a correlation coefficient (R) of 0.304 and weighted average of 29.2%, a difference of 9.1%.
Family Households with Children Correlation Summary
| Measurement | Immigrants from Lithuania | Immigrants from Cameroon |
| Minimum | 16.2% | 21.2% |
| Maximum | 37.4% | 45.8% |
| Range | 21.2% | 24.6% |
| Mean | 26.4% | 29.8% |
| Median | 26.4% | 29.6% |
| Interquartile 25% (IQ1) | 24.3% | 27.4% |
| Interquartile 75% (IQ3) | 27.5% | 31.5% |
| Interquartile Range (IQR) | 3.3% | 4.1% |
| Standard Deviation (Sample) | 4.2% | 4.2% |
| Standard Deviation (Population) | 4.1% | 4.1% |
Similar Demographics by Family Households with Children
Demographics Similar to Immigrants from Lithuania by Family Households with Children
In terms of family households with children, the demographic groups most similar to Immigrants from Lithuania are Immigrants from Jamaica (26.8%, a difference of 0.020%), Immigrants from Cuba (26.8%, a difference of 0.030%), Slavic (26.8%, a difference of 0.040%), Immigrants from Belarus (26.8%, a difference of 0.070%), and Scotch-Irish (26.8%, a difference of 0.080%).
| Demographics | Rating | Rank | Family Households with Children |
| Irish | 1.8 /100 | #252 | Tragic 26.8% |
| Italians | 1.5 /100 | #253 | Tragic 26.8% |
| Immigrants | Scotland | 1.5 /100 | #254 | Tragic 26.8% |
| German Russians | 1.5 /100 | #255 | Tragic 26.8% |
| Scotch-Irish | 1.4 /100 | #256 | Tragic 26.8% |
| Slavs | 1.3 /100 | #257 | Tragic 26.8% |
| Immigrants | Cuba | 1.3 /100 | #258 | Tragic 26.8% |
| Immigrants | Lithuania | 1.2 /100 | #259 | Tragic 26.8% |
| Immigrants | Jamaica | 1.2 /100 | #260 | Tragic 26.8% |
| Immigrants | Belarus | 1.1 /100 | #261 | Tragic 26.8% |
| Immigrants | Russia | 1.0 /100 | #262 | Tragic 26.8% |
| Immigrants | North Macedonia | 1.0 /100 | #263 | Tragic 26.7% |
| Taiwanese | 0.9 /100 | #264 | Tragic 26.7% |
| Chippewa | 0.9 /100 | #265 | Tragic 26.7% |
| Maltese | 0.9 /100 | #266 | Tragic 26.7% |
Demographics Similar to Immigrants from Cameroon by Family Households with Children
In terms of family households with children, the demographic groups most similar to Immigrants from Cameroon are Korean (29.2%, a difference of 0.14%), Immigrants from Venezuela (29.3%, a difference of 0.27%), Immigrants from Sierra Leone (29.3%, a difference of 0.28%), Yaqui (29.1%, a difference of 0.29%), and Central American (29.1%, a difference of 0.30%).
| Demographics | Rating | Rank | Family Households with Children |
| Yuman | 100.0 /100 | #30 | Exceptional 29.5% |
| Japanese | 100.0 /100 | #31 | Exceptional 29.4% |
| Immigrants | Yemen | 100.0 /100 | #32 | Exceptional 29.4% |
| Venezuelans | 100.0 /100 | #33 | Exceptional 29.4% |
| Immigrants | Bolivia | 100.0 /100 | #34 | Exceptional 29.3% |
| Immigrants | Sierra Leone | 100.0 /100 | #35 | Exceptional 29.3% |
| Immigrants | Venezuela | 100.0 /100 | #36 | Exceptional 29.3% |
| Immigrants | Cameroon | 100.0 /100 | #37 | Exceptional 29.2% |
| Koreans | 100.0 /100 | #38 | Exceptional 29.2% |
| Yaqui | 100.0 /100 | #39 | Exceptional 29.1% |
| Central Americans | 100.0 /100 | #40 | Exceptional 29.1% |
| Immigrants | South Eastern Asia | 100.0 /100 | #41 | Exceptional 29.1% |
| Spanish American Indians | 100.0 /100 | #42 | Exceptional 29.1% |
| Asians | 100.0 /100 | #43 | Exceptional 29.1% |
| Immigrants | Taiwan | 100.0 /100 | #44 | Exceptional 29.0% |