Immigrants from Canada vs Blackfeet Currently Married
COMPARE
Immigrants from Canada
Blackfeet
Currently Married
Currently Married Comparison
Immigrants from Canada
Blackfeet
48.8%
CURRENTLY MARRIED
99.4/ 100
METRIC RATING
40th/ 347
METRIC RANK
44.2%
CURRENTLY MARRIED
0.3/ 100
METRIC RATING
251st/ 347
METRIC RANK
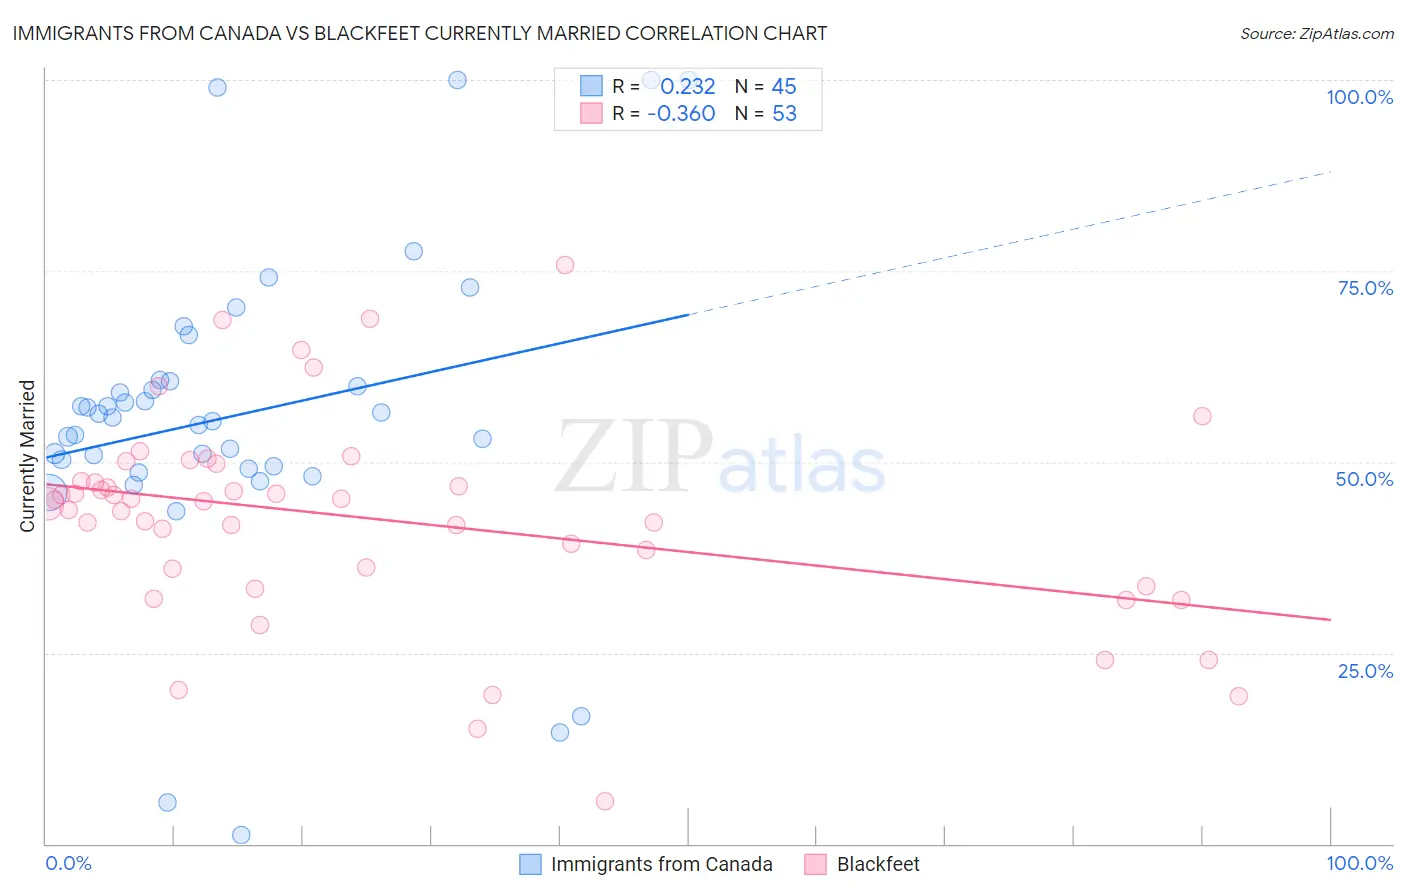
Immigrants from Canada vs Blackfeet Currently Married Correlation Chart
The statistical analysis conducted on geographies consisting of 459,334,543 people shows a weak positive correlation between the proportion of Immigrants from Canada and percentage of population currently married in the United States with a correlation coefficient (R) of 0.232 and weighted average of 48.8%. Similarly, the statistical analysis conducted on geographies consisting of 309,564,713 people shows a mild negative correlation between the proportion of Blackfeet and percentage of population currently married in the United States with a correlation coefficient (R) of -0.360 and weighted average of 44.2%, a difference of 10.5%.
Currently Married Correlation Summary
| Measurement | Immigrants from Canada | Blackfeet |
| Minimum | 1.1% | 5.5% |
| Maximum | 100.0% | 75.7% |
| Range | 98.9% | 70.2% |
| Mean | 56.1% | 42.5% |
| Median | 55.9% | 44.8% |
| Interquartile 25% (IQ1) | 49.3% | 34.9% |
| Interquartile 75% (IQ3) | 60.6% | 48.6% |
| Interquartile Range (IQR) | 11.4% | 13.7% |
| Standard Deviation (Sample) | 20.7% | 13.6% |
| Standard Deviation (Population) | 20.5% | 13.4% |
Similar Demographics by Currently Married
Demographics Similar to Immigrants from Canada by Currently Married
In terms of currently married, the demographic groups most similar to Immigrants from Canada are British (48.8%, a difference of 0.020%), Greek (48.8%, a difference of 0.020%), Czechoslovakian (48.8%, a difference of 0.050%), Finnish (48.8%, a difference of 0.060%), and Scotch-Irish (48.7%, a difference of 0.070%).
| Demographics | Rating | Rank | Currently Married |
| Irish | 99.5 /100 | #33 | Exceptional 48.9% |
| Immigrants | Lithuania | 99.4 /100 | #34 | Exceptional 48.8% |
| Immigrants | Northern Europe | 99.4 /100 | #35 | Exceptional 48.8% |
| Italians | 99.4 /100 | #36 | Exceptional 48.8% |
| Hungarians | 99.4 /100 | #37 | Exceptional 48.8% |
| Czechoslovakians | 99.4 /100 | #38 | Exceptional 48.8% |
| British | 99.4 /100 | #39 | Exceptional 48.8% |
| Immigrants | Canada | 99.4 /100 | #40 | Exceptional 48.8% |
| Greeks | 99.3 /100 | #41 | Exceptional 48.8% |
| Finns | 99.3 /100 | #42 | Exceptional 48.8% |
| Scotch-Irish | 99.3 /100 | #43 | Exceptional 48.7% |
| Immigrants | North America | 99.3 /100 | #44 | Exceptional 48.7% |
| Belgians | 99.3 /100 | #45 | Exceptional 48.7% |
| Immigrants | Iran | 99.2 /100 | #46 | Exceptional 48.7% |
| Northern Europeans | 99.2 /100 | #47 | Exceptional 48.7% |
Demographics Similar to Blackfeet by Currently Married
In terms of currently married, the demographic groups most similar to Blackfeet are Hispanic or Latino (44.1%, a difference of 0.020%), Immigrants from Central America (44.1%, a difference of 0.050%), Immigrants from Eastern Africa (44.2%, a difference of 0.060%), Immigrants from Cameroon (44.2%, a difference of 0.080%), and Nicaraguan (44.2%, a difference of 0.10%).
| Demographics | Rating | Rank | Currently Married |
| Japanese | 0.6 /100 | #244 | Tragic 44.5% |
| Immigrants | Armenia | 0.4 /100 | #245 | Tragic 44.3% |
| Immigrants | Burma/Myanmar | 0.4 /100 | #246 | Tragic 44.3% |
| Ugandans | 0.4 /100 | #247 | Tragic 44.2% |
| Nicaraguans | 0.3 /100 | #248 | Tragic 44.2% |
| Immigrants | Cameroon | 0.3 /100 | #249 | Tragic 44.2% |
| Immigrants | Eastern Africa | 0.3 /100 | #250 | Tragic 44.2% |
| Blackfeet | 0.3 /100 | #251 | Tragic 44.2% |
| Hispanics or Latinos | 0.3 /100 | #252 | Tragic 44.1% |
| Immigrants | Central America | 0.3 /100 | #253 | Tragic 44.1% |
| Vietnamese | 0.2 /100 | #254 | Tragic 44.0% |
| Yakama | 0.2 /100 | #255 | Tragic 44.0% |
| Shoshone | 0.2 /100 | #256 | Tragic 44.0% |
| Immigrants | Africa | 0.2 /100 | #257 | Tragic 43.9% |
| Ute | 0.2 /100 | #258 | Tragic 43.9% |