Dutch West Indian vs Blackfeet Single Mother Households
COMPARE
Dutch West Indian
Blackfeet
Single Mother Households
Single Mother Households Comparison
Dutch West Indians
Blackfeet
7.3%
SINGLE MOTHER HOUSEHOLDS
0.4/ 100
METRIC RATING
247th/ 347
METRIC RANK
7.5%
SINGLE MOTHER HOUSEHOLDS
0.1/ 100
METRIC RATING
267th/ 347
METRIC RANK
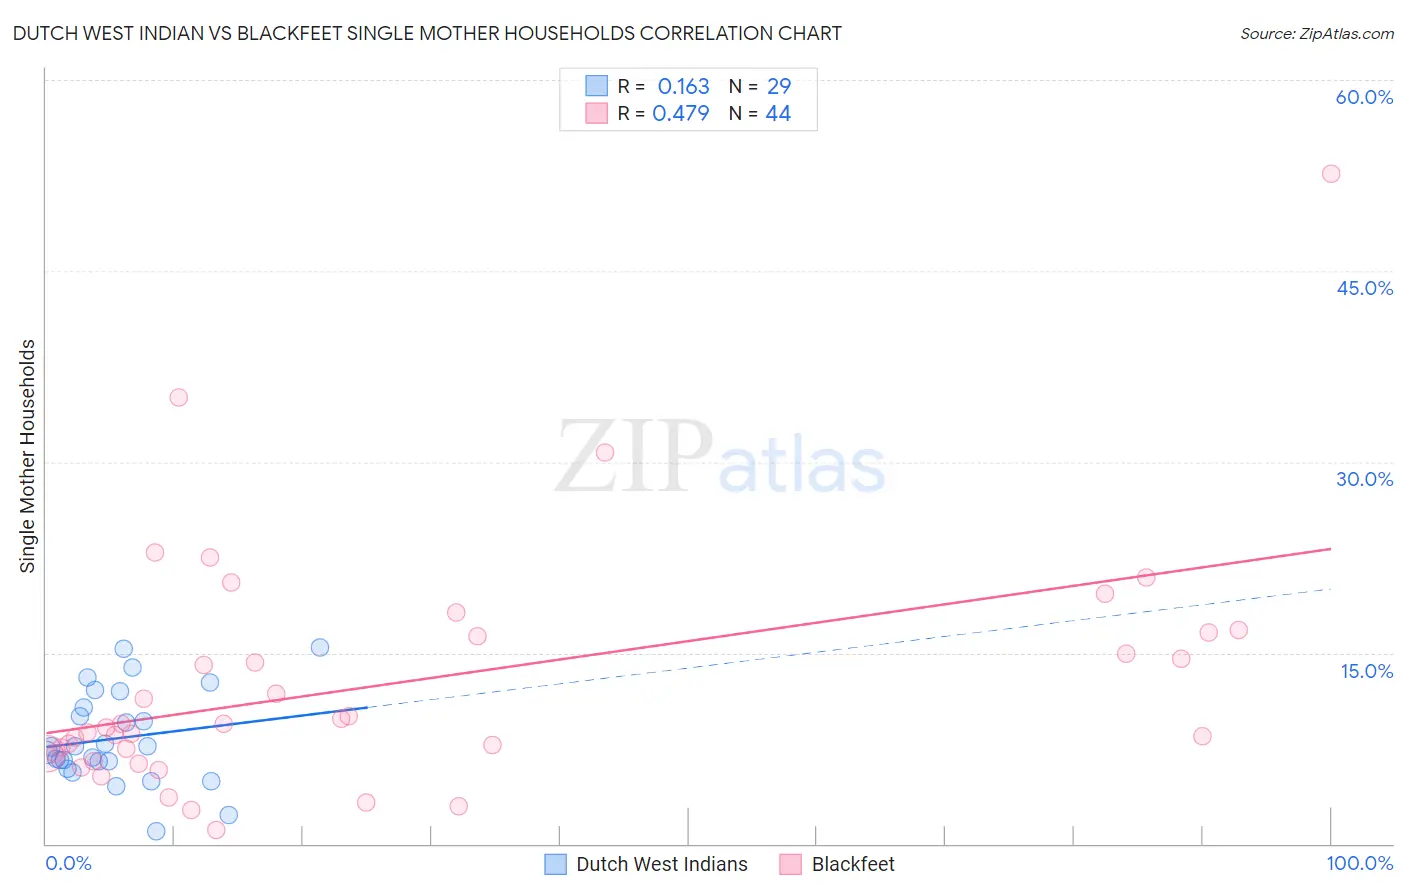
Dutch West Indian vs Blackfeet Single Mother Households Correlation Chart
The statistical analysis conducted on geographies consisting of 85,708,147 people shows a poor positive correlation between the proportion of Dutch West Indians and percentage of single mother households in the United States with a correlation coefficient (R) of 0.163 and weighted average of 7.3%. Similarly, the statistical analysis conducted on geographies consisting of 309,066,694 people shows a moderate positive correlation between the proportion of Blackfeet and percentage of single mother households in the United States with a correlation coefficient (R) of 0.479 and weighted average of 7.5%, a difference of 3.1%.
Single Mother Households Correlation Summary
| Measurement | Dutch West Indian | Blackfeet |
| Minimum | 0.97% | 1.1% |
| Maximum | 15.4% | 52.6% |
| Range | 14.4% | 51.5% |
| Mean | 8.3% | 12.5% |
| Median | 7.6% | 9.2% |
| Interquartile 25% (IQ1) | 6.2% | 7.1% |
| Interquartile 75% (IQ3) | 11.3% | 16.4% |
| Interquartile Range (IQR) | 5.2% | 9.3% |
| Standard Deviation (Sample) | 3.6% | 9.5% |
| Standard Deviation (Population) | 3.6% | 9.4% |
Demographics Similar to Dutch West Indians and Blackfeet by Single Mother Households
In terms of single mother households, the demographic groups most similar to Dutch West Indians are Spanish American Indian (7.3%, a difference of 0.030%), Bermudan (7.3%, a difference of 0.32%), Immigrants from Africa (7.3%, a difference of 0.33%), Malaysian (7.3%, a difference of 0.68%), and Alaskan Athabascan (7.3%, a difference of 0.70%). Similarly, the demographic groups most similar to Blackfeet are Nepalese (7.5%, a difference of 0.34%), Crow (7.4%, a difference of 0.43%), Yaqui (7.4%, a difference of 0.61%), Immigrants from Nicaragua (7.4%, a difference of 0.69%), and Immigrants from Somalia (7.4%, a difference of 0.84%).
| Demographics | Rating | Rank | Single Mother Households |
| Dutch West Indians | 0.4 /100 | #247 | Tragic 7.3% |
| Spanish American Indians | 0.4 /100 | #248 | Tragic 7.3% |
| Bermudans | 0.4 /100 | #249 | Tragic 7.3% |
| Immigrants | Africa | 0.4 /100 | #250 | Tragic 7.3% |
| Malaysians | 0.3 /100 | #251 | Tragic 7.3% |
| Alaskan Athabascans | 0.3 /100 | #252 | Tragic 7.3% |
| Cajuns | 0.3 /100 | #253 | Tragic 7.3% |
| Immigrants | Ecuador | 0.3 /100 | #254 | Tragic 7.3% |
| Mexican American Indians | 0.2 /100 | #255 | Tragic 7.4% |
| Seminole | 0.2 /100 | #256 | Tragic 7.4% |
| Alaska Natives | 0.2 /100 | #257 | Tragic 7.4% |
| Pueblo | 0.2 /100 | #258 | Tragic 7.4% |
| Immigrants | Yemen | 0.2 /100 | #259 | Tragic 7.4% |
| Immigrants | Zaire | 0.2 /100 | #260 | Tragic 7.4% |
| Japanese | 0.2 /100 | #261 | Tragic 7.4% |
| Immigrants | Somalia | 0.2 /100 | #262 | Tragic 7.4% |
| Immigrants | Nicaragua | 0.2 /100 | #263 | Tragic 7.4% |
| Yaqui | 0.1 /100 | #264 | Tragic 7.4% |
| Crow | 0.1 /100 | #265 | Tragic 7.4% |
| Nepalese | 0.1 /100 | #266 | Tragic 7.5% |
| Blackfeet | 0.1 /100 | #267 | Tragic 7.5% |